My journey from a Teacher to Data analysis
https://www.credly.com/badges/17bb38b0-40d2-490f-adbf-eb82de46aadb/public_url
R Studio Programme
This week’s dataset involved deep diving into penguin habits to understand their body mass and other aspects:
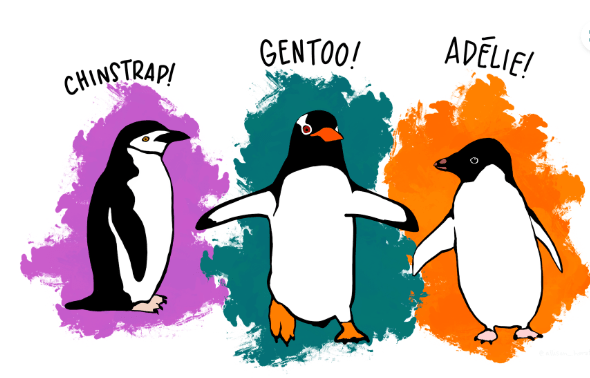
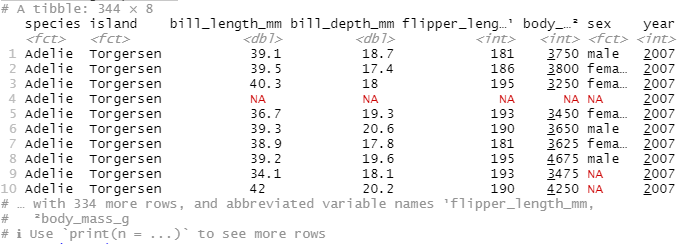
The Palmer Penguins is a dataset constructed by Dr. Kirsten Gorman and relates to the structural size measurements of 3 species of penguins: adult, male and female Adelie, Chinstrap and Gentoo penguins. The data was collected at Palmer station Antarctica LTER between the period 2007-09. For each species, 4 structural size measurements were collected: bill length, bill depth, flipper length, and body mass. In total 344 samples were collected (however 2 samples have missing structural size measurements).
The data on the 3 different species of Penguins was collected from 3 islands in the Palmer archipelago in Antarctica. These islands are the Dream island, Torgerson island and Biscoe island
cite artwork @allison horst

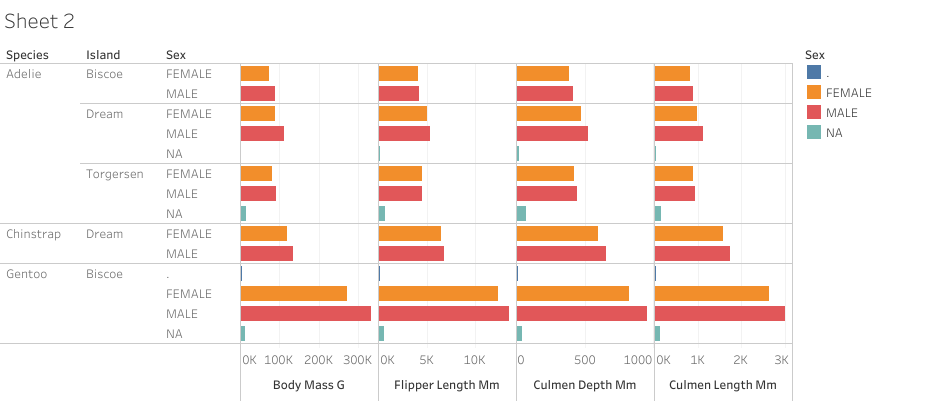
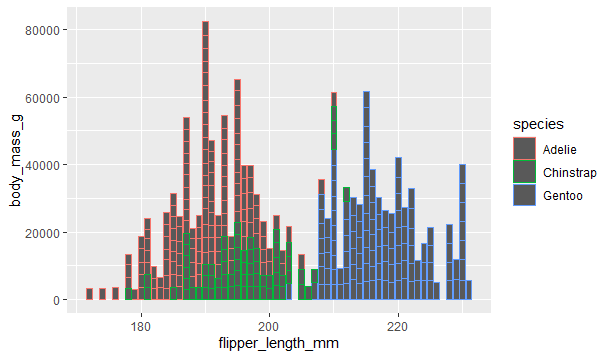
My analysis of the following bar graph
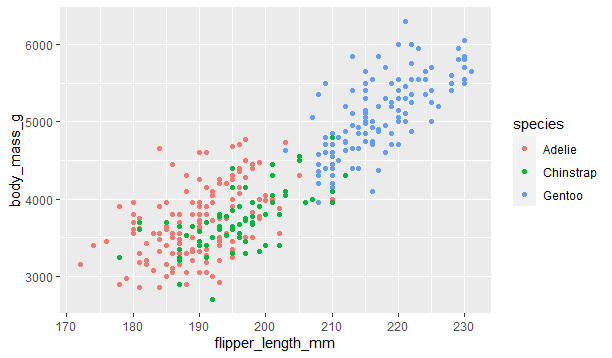
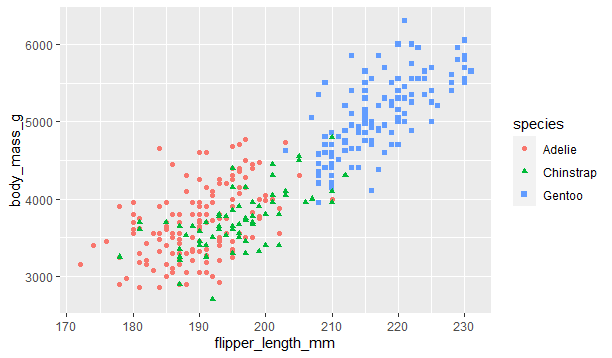
Of all the Palmer penguins, Gentoos are the largest. The second is Chinstrap and the last is Adelie.
Adelie species of Torgersen Island penguin’s male and female have negligible differentiation in body mass, flipper length, culmen depth, and culmen length
let’s start coding
install r studio
install.packages(tidyverse)
library (tidyverse)
Install.packages(ggplot2)
library(ggplot2)
install.packages(palmerpenguins)
library(palmerpenguins)
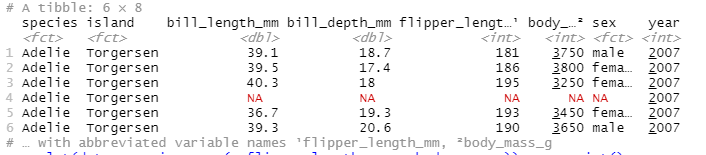
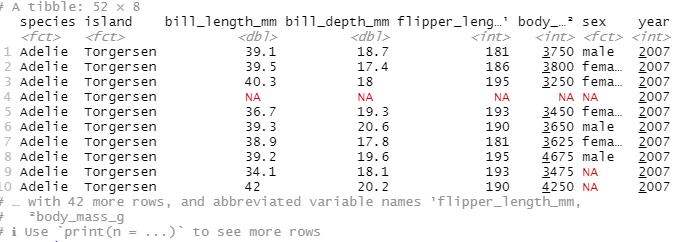
head(penguins)
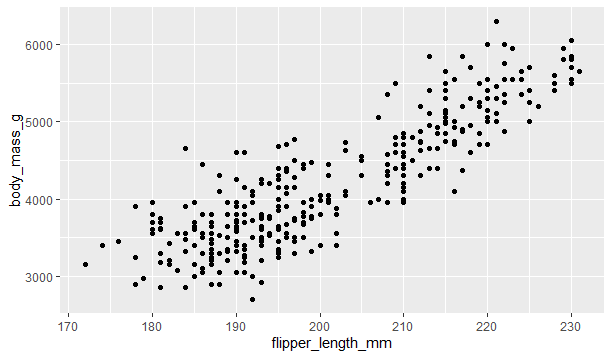
ggplot(data=penguins, aes(x=flipper_length_mm, y=body_mass_g))+geom_point()

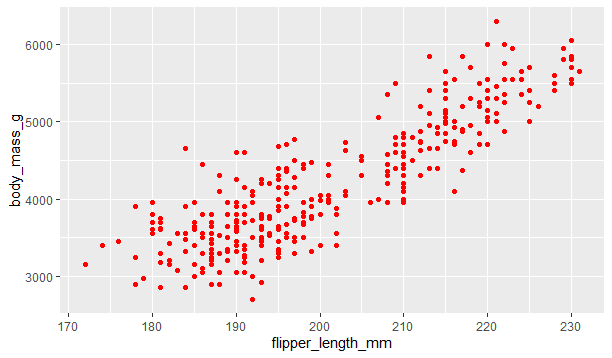
ggplot(data=penguins, aes(x=flipper_length_mm, y=body_mass_g))+geom_point(color=”red”)
ggplot(data=penguins, aes(x=flipper_length_mm, y=body_mass_g))+geom_point(aes(color=species))
ggplot(data=penguins, aes(x=flipper_length_mm, y=body_mass_g))+geom_bar(aes(shape=species, color=species))
ggplot(data=penguins, aes(x=flipper_length_mm, y=body_mass_g))+geom_bar(aes(shape=species, color=species))
ggplot(data=penguins, aes(x=flipper_length_mm, y=body_mass_g))+geom_boxplot(aes( color=species))

ggplot(data=penguins, aes(x=flipper_length_mm, y=body_mass_g))+geom_col(aes( color=species))
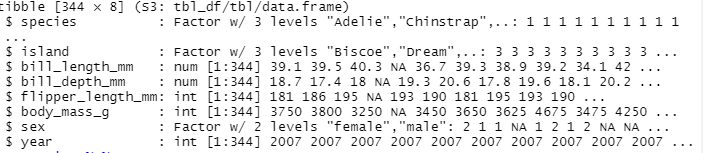
str(penguins)
penguins %>%
group_by(species) %>%
summarize(across(where(is.numeric), mean, na.rm = TRUE))

penguins %>%
filter(island == “Torgersen”
penguins %>%
arrange(species)
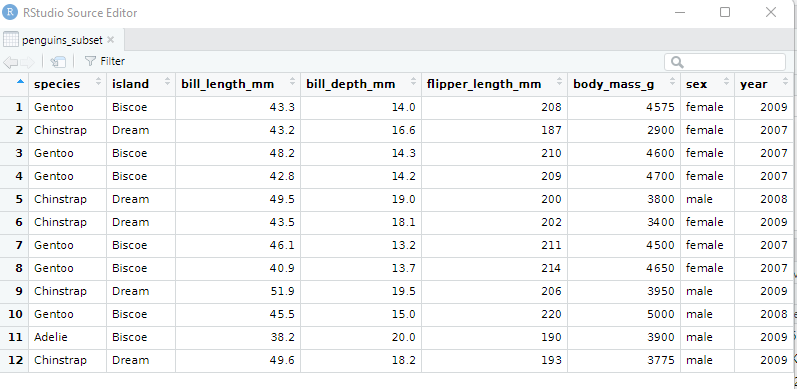
penguins_subset <- penguins %>%
sample_n(12)
view(penguins_subset)
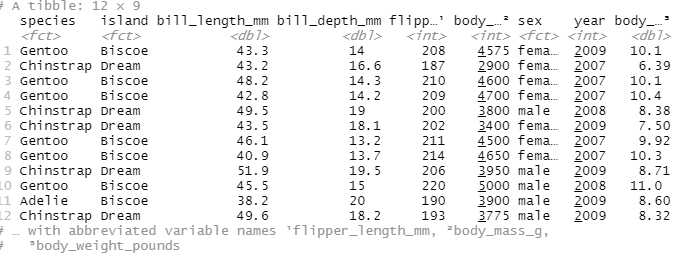
penguins_subset %>%
mutate(body_weight_pounds = body_mass_g / 453.59237)
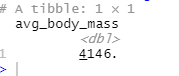
penguins_subset %>%
      summarise(avg_body_mass = mean(body_mass_g))