"MBA in Finance | Personal Finance & Borrower Education"
Author: Laxmi Hegde
Hi, I’m Laxmi Hegde 👋
MBA in Finance by degree, restaurant owner by profession, and full-time workaholic by… let’s call it “diagnosis.” When I’m not crunching numbers or managing my restaurant, you’ll probably find me chasing new ideas, planning my next big move, or spoiling my dogs like they’re royalty. 🐶✨
This blog is my creative escape—a place where I share travel adventures, skincare secrets, and a few life hacks I’ve picked up along the way. Think of it as part travel guide, part lifestyle diary, with a dash of humor (because life’s too short to be serious all the time).
Oh, and in case you’re wondering: yes, I’m still learning how to not work 24/7. Spoiler alert—I’m failing gloriously. 😅
Welcome to my little corner of the internet—grab a coffee, stay a while, and let’s explore together!
Traveling with the wrong laptop is like wearing flip-flops to hike the Swiss Alps — you’ll regret it halfway through. Whether you’re editing travel vlogs from a beach in Bali, crunching spreadsheets in an airport lounge, or binge-watching Netflix in a Tokyo capsule hotel, the right laptop makes all the difference.
In this guide, we’re comparing traveler-friendly laptops from Amazon and Discount Electronics — two very different shopping experiences. One’s the global megastore where you can buy everything from a laptop to llama socks in the same cart, the other is a curated shop of refurbished, business-grade workhorses built to survive years of hard use.
We’ll look at performance, weight, durability, and price — and yes, I’ve sprinkled in some personal travel wisdom along the way.
✈ Why Compare Amazon and Discount Electronics?
Amazon: Fast shipping, easy returns, brand-new models, and plenty of buyer reviews for peace of mind.
Discount Electronics: U.S.-based refurbished specialist, up to 40–60% cheaper, and often customizable (RAM & SSD upgrades). Perfect if you don’t mind a laptop with a past life.
💻 Best Laptops for Travelers – Amazon vs. Discount Electronics
Before you click “Buy Now” faster than you can say “boarding group 5,” here’s what I’ve learned from years of hauling laptops through airports, coffee shops, and the occasional questionable hostel Wi-Fi network:
Know Your Travel Style If you’re the kind of traveler who plans a weekend in Rome on a Wednesday, Amazon is your friend. Their massive range and lightning-fast delivery mean you could be editing travel photos on your new machine before your suitcase is even packed.
Don’t Just Look at the Price Tag Sure, Discount Electronics might make you blink twice at first. But remember — they specialize in business-grade laptops that have been hand-tested, often upgraded, and come with solid warranties. Think of it as buying a used Mercedes from a high-end dealership instead of from your cousin Kevin who swears “it runs fine.” You’re paying for reliability and peace of mind — which matters when you’re halfway across the globe and your laptop is your office.
Size and Weight Matter On paper, the difference between 2.5 lbs and 3 lbs doesn’t seem like much. But after lugging it through four airports, two train stations, and one cobblestoned old town, your shoulder will tell a different story. Aim for under 3 lbs if you can.
Think Beyond Specs Bang & Olufsen speakers? Yes, the HP EliteBook 830 G7’s audio is great for Netflix binges in hotel rooms. A legendary ThinkPad keyboard? Perfect for long nights writing travel blogs (or love letters from Lisbon). Sometimes the “feel” of a laptop matters just as much as the numbers on the spec sheet.
Check the Return Policy Before You Fly Whether it’s Amazon or Discount Electronics, make sure you know the return window — ideally one that lasts long enough for you to test your new machine before your trip
When choosing a travel laptop, don’t just think about speed and storage — think about how you’ll use it on the road. Amazon is your go-to for variety and speed, while Discount Electronics is the “long-haul” option for durable, business-grade gear. Either way, your laptop should make your travels easier, not heavier.
Safe travels — and may your Wi-Fi always be strong and your coffee always be free.
Product gallery:
Dell Latitude 7420 14-inch Full HD Touchscreen Business Laptop 11th Gen Intel Core i7-1185G7 32GB 1TB SSD Windows 11 ProDell Latitude 7420 11th Generation i5 Windows 11 Pro 14″ Laptop FHD RefurbishedLenovo Thinkpad X1 Carbon Gen 9 14″ Laptop i7-1185G7 16GB 512 GB SSD W11P (Renewed)Lenovo ThinkPad X1 Carbon Gen 10 Core i7-1270P 14″ UHD 4K Windows 11 Laptop RefurbishedHP EliteBook 830 G7 i5 16GB Windows 11 Bang & Olufsen Laptop RefurbisheHP EliteBook 830 G7 Laptop | 13.3″ 1920×1080 FHD | Core i5-10310U – 512GB SSD Hard Drive – 16GB RAM | 4 cores @ 4.4 GHz Win 11 Home Silver (Renewed)
“Watch our comparison of the best travel laptops on Amazon vs. Discount Electronics—lightweight, affordable, and perfect for digital nomads!”
Introduction: Your Perfect Weekend Getaway from London
Top Destination Ideas for Every Traveler
For History Lovers: Bath and Oxford
For Nature Enthusiasts: The Cotswolds and Lake District
For Coastal Charm: Brighton and Cornwall
For Culture and Fun: Edinburgh and Liverpool
Planning Your Escape: A Step-by-Step Guide
How to Get There: Train, Car, or Coach?
Booking Tips: Accommodation and Attractions
What to Pack for a UK Weekend
Sample Weekend Itinerary: A Weekend in the Cotswolds
Day 1: Exploring Quaint Villages (Bibury, Bourton-on-the-Water)
Day 2: Country Walks and a Historic Castle (Sudeley Castle)
Making the Most of Your Short Trip
Budget-Friendly Tips
How to Avoid the Crowds
Conclusion: Start Planning Your Adventure
Top Picks for a Quick Reset — Without Losing Your Mind
Let’s be real — London is amazing. But sometimes, you just need to get out. Breathe some non-Tube air. Remind yourself there’s more to life than queueing politely.
If you’ve been staring out your flat’s window dreaming of a little getaway (but your calendar’s yelling “WEEKEND ONLY”), I’ve got you covered. Whether you’re a city explorer, beach bum, or history nerd, this blog has your escape plan mapped — and yes, you can book it all last-minute without a mental breakdown.
According to recent stats, London ranks among the most visited cities in the world, which is no surprise — but escaping from London is now the trend no one talks about. Until now.
✈️ Flight Delayed or Canceled? Travel isn’t always smooth sailing—sometimes flights get delayed, canceled, or overbooked. The good news? You might be entitled to up to $650 in compensation under air passenger rights. Most travelers never claim it, but I’ve got you covered: just check your flight with AirHelp. They handle the paperwork, fight the airlines for you, and only get paid if you win. Easy, stress-free, and potentially a nice surprise for your travel fund.
✈️ Travel Tip: Staying connected abroad can be tricky (and expensive if you’re relying on airport SIM counters or roaming). That’s why I carry a Drimsim—a universal SIM card that works in 190+ countries without hidden fees. You just pop it into your phone, top up through the app, and you’re online wherever your adventure takes you. No more hunting for local SIM cards or stressing over roaming bills. If you’re planning your next getaway, check it out here 👉 Drimsim: SIM Card for Traveling Around the World.
💡 Pro Travel Tip: While hopping on metro, tram, or bus is super easy, travel hiccups like delays, lost luggage, or sudden medical emergencies can happen anywhere. That’s why I always carry travel insurance before jetting off. It gives peace of mind knowing I’m covered, no matter what. I personally recommend VisitorsCoverage Travel Insurance — quick to book, affordable, and traveler-friendly.
🚆 Quick-Hit Escapes Within Reach from London
1. Bath, England — For Georgian Romance and Natural Hot Springs
Travel Time: ~1.5 hours by train Ideal For: Couples, history lovers, Jane Austen fans
There’s something cinematic about Bath. The golden stone, the Roman Baths, and that soft mist on a chilly morning. Pro tip: avoid weekends during high summer if you hate crowds. Instead, visit mid-spring or early fall for that perfect balance of sunshine and sanity.
Travel Tip: The Great Western Railway from Paddington gets you there fast. Pack your camera — this lens recommendation changed how I shoot architecture forever.
“Roman Baths & Abbey
Above image Fully public domain,
The grand Georgian facade of the Roman Baths in Bath, Somerset — a UNESCO World Heritage Site and one of the city’s most iconic landmarks.
🚗 How to Get to Bath from London (Without Stressing)
Whether you’re chasing Jane Austen vibes or just need a Georgian-era reset, getting to Bath from London is super easy — even if you’re not a seasoned traveler.
Booking Tip: Use GWR or Trainline for deals, and aim for off-peak hours if you like empty seats and quiet rides.
👉 Pro Tip: Sit on the right-hand side of the train for countryside views, especially as you glide past Wiltshire’s rolling hills.
🚗 By Car (For the Scenic Route)
Distance: ~115 miles (185 km)
Driving Time: ~2.5 hours (depending on traffic)
Route: M4 westbound → Exit at Junction 18 → A46 → Bath City Centre
Parking: Try Charlotte Street Car Park or SouthGate Bath Car Park for easy walking access to the Roman Baths and Abbey.
👉 Navigation Tip: Use Google Maps or Waze with NordVPN when connecting to free public WiFi along the route — it keeps your data safe and your Spotify playlist uninterrupted.
✨ Bonus: Make It a Mini-Road Trip
If you’re driving, stop at Castle Combe — dubbed “the prettiest village in England” — or grab a pub lunch in Lacock, a filming location for Harry Potter and Downton Abbey.
2. Bruges, Belgium — For Fairytale Feels and Chocolate-Soaked Walks
Travel Time: ~3.5 hrs (Eurostar to Brussels, local train to Bruges) Ideal For: Foodies, couples, solo travelers needing a reset
Think canals, cobblestone lanes, and the best hot chocolate of your life. You will take 300 photos of the same swan gliding across the water — just lean into it. If you love travel hacks, check out my post on 10 tips that saved me hundreds.
Bruges, Belgium—where every corner looks like a postcard. From canals to cobblestones, this city redefines storybook charm.
Bonus Tip: Download maps and translation apps before you leave using NordVPN to secure your connection, especially on public WiFi at train stations and Airbnbs.
3. Paris, France — For a Taste of Glam in a Weekend
Travel Time: ~2.5 hours via Eurostar Ideal For: Romantic souls, culture vultures, fashionistas on a budget
Yes, Paris is cliché. But it’s also magic. Skip the Eiffel Tower queues and stroll Montmartre at sunrise. If you’ve already done Paris and want more, check out my blog on weekend escapes beyond Paris — because why stop at one baguette?
Tip: Book your hotel last-minute with Expedia — I’ve found deals that had me doing a double-take. Flexible stays = stress-free spontaneity.
🌴 Feeling Beachy? Head Here:
4. Brighton, UK — Seaside Vibes with a Boho Twist
Travel Time: ~1 hour by train Ideal For: Creative types, beach lovers, anyone who owns a ukulele (no judgment)
Fish & chips. Pebble beaches. Vintage shops that smell like incense and broken dreams. Brighton is quirky, charming, and the perfect low-effort escape. Pack sunscreen. And a hoodie. Because UK.
5. The Cotswolds — For Rolling Hills and Pub Fires
Travel Time: ~2 hours by car or 2.5 by train + bus Ideal For: Solo travelers, wellness seekers, digital detoxers
This place is practically a watercolor painting. Walk, sip tea, read a book in a field and heal. If you’re a solo traveler, I’ve got a blog just for you: Top 5 Destinations for Soulful Solo Travelers.
Pair it with Expedia’s mobile app and you’ll be sipping wine in another country before your coworkers even notice your Slack status changed to “offline.”
🧳 What to Pack for a Weekend Escape
Power bank (and an extra charger because you will forget it somewhere)
Layers. Always layers. The UK weather is… opinionated.
A good travel lens — I swear by this one for Instagram-worthy shots
Your weekend escape doesn’t need to be a grand production. Sometimes it’s just about changing your view, hearing a new accent, or trying a croissant that makes you question your life choices.
You don’t need a 10-day leave or a spreadsheet to travel — just a packed bag, a smart itinerary, and a sense of humor.
If you’re feeling stuck, tired, or just too London lately, this is your sign to take off. Start planning your reset with Expedia today.
📣 Let’s Chat!
Have a favorite weekend escape I missed? Drop it in the comments! Or better yet, tag me on your next getaway pic — I might just feature you in my next post.
🧳 Safe travels,
💡Tip: Bookmark this blog or add a sticky banner so it’s handy the next time you impulsively check train prices on a Thursday night.
✈️ Weekend in London? Here’s how to escape the city and come back feeling brand new — even on a tight schedule. 🇬🇧 📍Hidden gems, stress-free travel tips, and a splash of humor. #WeekendVibes #TravelSmart
Frequently Asked Questions (FAQ)
Q1: What is the best destination for a weekend trip from London by train? Oxford and Brighton are two of the best and easiest options. Both are less than a 90-minute direct train ride from central London, meaning you’ll have more time to explore and less time traveling.
Q2: Is it better to drive or take the train? It depends on your destination. Trains are fast, efficient, and stress-free for cities like Bath, Oxford, or Brighton where parking is difficult. Driving is better for exploring the countryside and remote villages, like those in the Cotswolds or the Peak District, where public transport links are less frequent.
Q3: How far in advance should I book? For the best prices and availability, especially for popular destinations and during peak seasons (summer, bank holidays), it’s wise to book trains and accommodation several weeks to a few months in advance.
Q4: Can I realistically visit Edinburgh or Cornwall for a weekend? Yes, but it’s a longer journey. Edinburgh is a 4.5-hour train ride from London, making a Friday evening to Sunday evening trip perfectly feasible. Cornwall is a longer trek (5+ hours by train or car), so it’s better for a long weekend if possible, but a two-day trip is still doable if you plan carefully.
Q5: What are some budget-friendly tips for a UK weekend trip?
Book train tickets in advance for the cheapest “Advance” fares.
Look for accommodation that includes breakfast.
Explore free attractions like museums, parks, and historic town centers.
Picnic with supplies from a local supermarket or market.
Q6: What should I pack for a weekend in the British countryside? Always pack layers! The weather is famously changeable. Essentials include a waterproof jacket, comfortable walking shoes or boots, a warm layer (like a fleece), and an umbrella. Even in summer, it’s best to be prepared for rain.
Q7: Are these destinations suitable for a solo trip? Absolutely. Cities like Oxford, Bath, and Brighton are very safe and easy to navigate for solo travelers. The excellent UK train system also makes solo travel straightforward and enjoyable.
Introduction: Why Used is the Smart Choice for Smart Photographers
What to Look For When Buying a Used Camera
Top 5 Used Cameras That Crush New Budget Models
Canon EOS 5D Mark III: The Legendary Workhorse
Nikon D750: The Dynamic Range King
Sony Alpha a7 II: Your Gateway to Full-Frame Mirrorless
Fujifilm X-T2: The Analog Soul in a Digital Body
Olympus OM-D E-M1 Mark II: The Pocket-Sized Powerhouse
Where to Safely Buy Used Camera Gear
How to Test a Used Camera Before You Buy
Conclusion: Invest in Performance, Not Just Newness
If you’ve ever felt the sting of buyer’s remorse after picking up a budget camera that just doesn’t deliver the goods—you’re not alone. In fact, many seasoned photographers (and smart beginners) are turning to high-quality used cameras that outperform many of today’s newer, cheaper models. Why? Because a well-loved DSLR or mirrorless camera from a few years ago often packs more punch, better build, and a legacy of top-tier imaging than a brand-new budget release.
Whether you’re a traveler, a budding content creator, or someone looking to elevate your Instagram game, going the “used” route can save you money and give you better results.
Let’s dive into the Top 5 Used Cameras that still outshine many fresh-off-the-shelf budget options—and are often available for less than you think.
1. Canon EOS 5D Mark III – A Workhorse That Never Quits
Type: Full-frame DSLR Why it’s better:
Stunning image quality even by 2025 standards
Excellent low-light performance
Dual card slots (rare in budget cameras)
Built like a tank
📷 I borrowed one of these during a photography trip to the Scottish Highlands. The dynamic range blew me away—sunrise shots were sharp, golden, and needed minimal editing.
Perfect for: Wedding photographers, landscape lovers, and serious hobbyists
If you’re based in UK, Europe, or the US, buying from Camera World UK ensures faster shipping and fewer import headaches. Pair that with a currency edge and you’ve got even better value than many local sellers.
💬 Final Thoughts: Older Can Be Smarter
Sometimes, shiny and new doesn’t mean better. Investing in a reliable used camera can open creative doors, sharpen your skills, and give you access to features that low-end new models just don’t have.
Plus, by shopping used, you’re also making an eco-friendly choice—less e-waste, less manufacturing, and more meaningful photography.
📌 Don’t Miss Out!
Got a favorite used camera that never let you down? Drop it in the comments below—let’s geek out together.
Looking for a camera that won’t break the bank but still delivers pro-level performance? In this video, we count down the Top 5 used cameras that outperform most budget models on the market in 2025. From Nikon’s legendary DSLR builds to film classics like the Olympus OM1, these picks are trusted by smart photographers who want quality without the premium price tag. 💡 Perfect for content creators, photography students, or hobbyists who want to level up on a budget! 👉 Watch now and discover which camera suits your style — and your wallet. 📸 Check out the full blog for deep dives and purchase links: Top 5 Used Cameras Blog
Frequently Asked Questions (FAQ)
Q1: Why should I buy a used professional camera instead of a new budget one? You get significantly better value. A used high-end model from a few years ago often offers superior build quality, advanced autofocus, better low-light performance, and more robust features than a new entry-level camera, all for a similar price.
Q2: What is the biggest risk when buying a used camera? The biggest risk is the unknown shutter count (how many photos the camera has taken) and the general condition of the sensor and internal mechanics. Always ask for the shutter count, as it is the best indicator of a camera’s life expectancy.
Q3: How do I check the shutter count? Shutter count is not displayed in the camera’s EXIF data by default. You typically need to upload an unedited photo taken with the camera to a dedicated online shutter count website, or use specific software. Sellers of reputable used gear will often provide this information upfront.
Q4: Where is the safest place to buy a used camera?
Online Marketplaces: (e.g., eBay, Facebook Marketplace) offer more variety but require more diligence. Always check seller ratings and use secure payment methods.
Local Camera Stores: Often have a used section where you can inspect the gear in person.
Q5: Is mirrorless or DSLR better to buy used? This depends on your needs. Used DSLRs like the Canon 5D Mark III or Nikon D750 offer incredible performance for a lower price as the market has shifted to mirrorless. Used mirrorless cameras, like the Sony a7 II, offer newer technology like in-body stabilization and electronic viewfinders. Both are excellent values.
Q6: What are some specific things I should test when I get the camera?
Check for sensor dust by taking a photo of a white wall at a small aperture (e.g., f/16).
Test all dials, buttons, and ports.
Take photos at various shutter speeds to listen for unusual sounds.
Inspect the lens mount for wear and the body for signs of major impact.
Q7: What is a good shutter count to look for? It varies by model, but a general guideline:
Under 20,000: Very low use, like new.
20,000 – 50,000: Light use. Excellent condition.
50,000 – 100,000: Moderate use. Most consumer cameras are fine well past 100,000.
100,000+: Heavy use. Pro-level cameras are built for 300,000-500,000+ actuations, but the price should reflect the higher count.
Budget-Friendly (Under $500): Great Value for Beginners
Mid-Range ($500 – $1000): The Sweet Spot for Enthusiasts
Premium ($1000 – $2000): For Serious Photographers
No-Limits (Above $2000): Professional Grade Performance
Top Camera Models Head-to-Head Comparison
Essential Travel Photography Accessories
Final Verdict: Our Top Picks for Different Travelers
Conclusion: Capture Your Next Adventure
Whether you’re capturing the dunes of Dubai, the streets of Paris, or glowing skin on your next skincare retreat, having the right travel camera can make all the difference.
Smartphone cameras are great—but if you’re serious about quality content for Instagram, TikTok, Pinterest, or your travel blog, investing in a real camera pays off.
In this guide, I’m comparing the best cameras for travel in 2025 based on:
📷 Price (from budget to premium)
🎒 Portability
🧠 Features that matter to travelers (like Wi-Fi sharing, stabilization, waterproofing)
🌍 Global availability on Amazon (with affiliate links included)
Let’s find the one that fits your style and your suitcase.
“Newest 2025 Travel Picks: Insta360 X5 vs DJI Osmo 360 vs OM‑5”
Insta360 X5 (≈ $550)
Ideal for: 360° content creators who value image quality, low‑light performance, and repairability. Launched April 22, 2025, the X5 features dual 1/1.28″ sensors and an AI‑powered processing pipeline (Triple AI Chip) that provides industry‑leading 8K 30 fps or 5.7K 60 fps capture, plus PureVideo mode for crisp night shooting and magnetic, user-replaceable lenses for rugged travel use Amazon+5Wikipedia+5Insta360+5.
Insta360 X5 – Waterproof 8K 360° Action Camera, It delivers up to ~80 minutes battery life in 8K mode, an improved wind‑guarded mic, and a new Instaframe option that records 360° and flat video simultaneously WIRED+1. Pitch: “Grab the Insta360 X5 ( link) and shoot ultra-smooth 8K travel clips that pop—without worrying about cloudy skies or swapping your gear mid-trip.”
DJI Osmo 360 (≈ $550 Standard / $700 Adventure Combo)
Best for: DJI ecosystem users, budget-conscious adventurers, and longer recording sessions. Released globally in July 2025 (not yet available in the U.S.), this is DJI’s first 360° action cam. It sports dual 1/1.1″ square HDR sensors and f/1.9 aperture for stellar low-light and high dynamic range footage, offering 8K at 50 fps, 6K at 60 fps, and even 4K at 100 fps single‑lens Boost modeDJI Official+3Tom’s Guide+3The Verge+3. Boasts superior battery endurance—up to 100 minutes @8K—and includes 128 GB onboard storage, plus integration with DJI wireless mics. It lacks replaceable lenses, but makes up for it with a compact 183 g build, magnetic mounts, and solid IP68 ruggedness WIRED+11The Verge+11techradar.com+11. Pitch: “Order the DJI Osmo 360 (not available yet but similar product Insta360 X5 – Waterproof 8K 360° Action Camera, ) and enjoy immersive 8K travel footage for longer—up to 100 minutes—plus stellar stabilization and DJI mic support right out of the box.”
“If you’re already using DJI gear, Osmo 360 offers plug‑and‑play integration with your mics and batteries.”
🔍 Side-by-Side Spec Comparison
Model
Sensor Size
Video Modes
Low-Light Ability
Battery Life
Lens
Storage
Weight
Weather Rating
Approx. Price
Insta360 X5
Dual 1/1.28″
8K30, 5.7K60, 4K120
Excellent (PureVideo)
~80 min @8K
Replaceable
microSD
~185 g
IPX8 (15 m)
~$550
DJI Osmo 360
Dual 1/1.1″ HDR
8K50, 6K60, 4K100 Boost
Very high (13.5 stops)
~100 min @8K
Fixed
128 GB built-in
183 g
IP68 (not for deep dive)
~$550–700
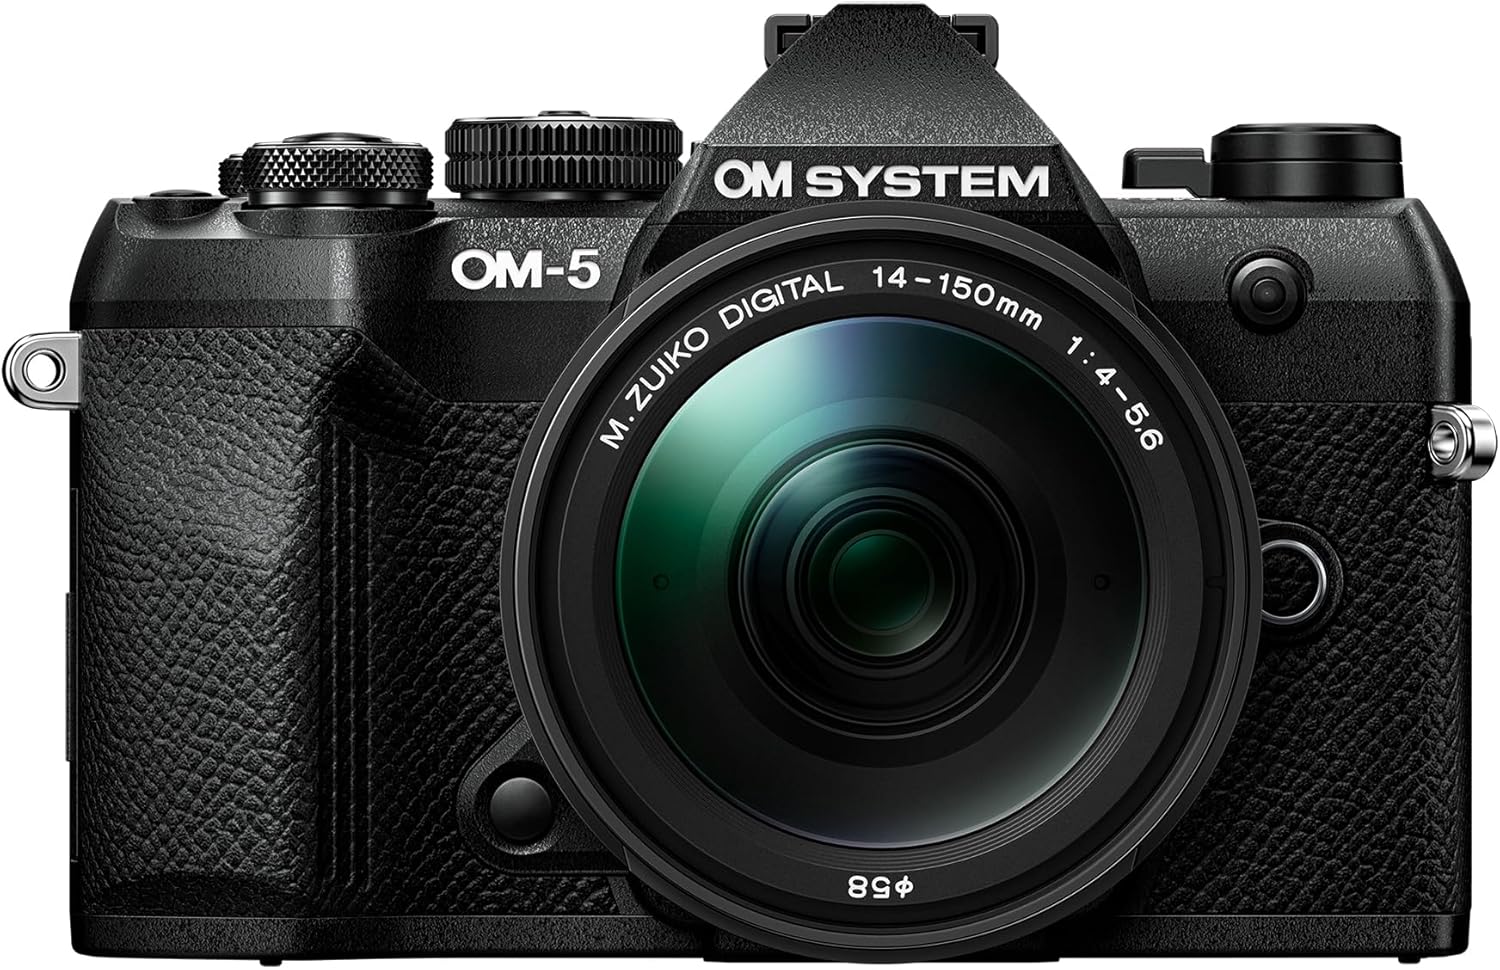
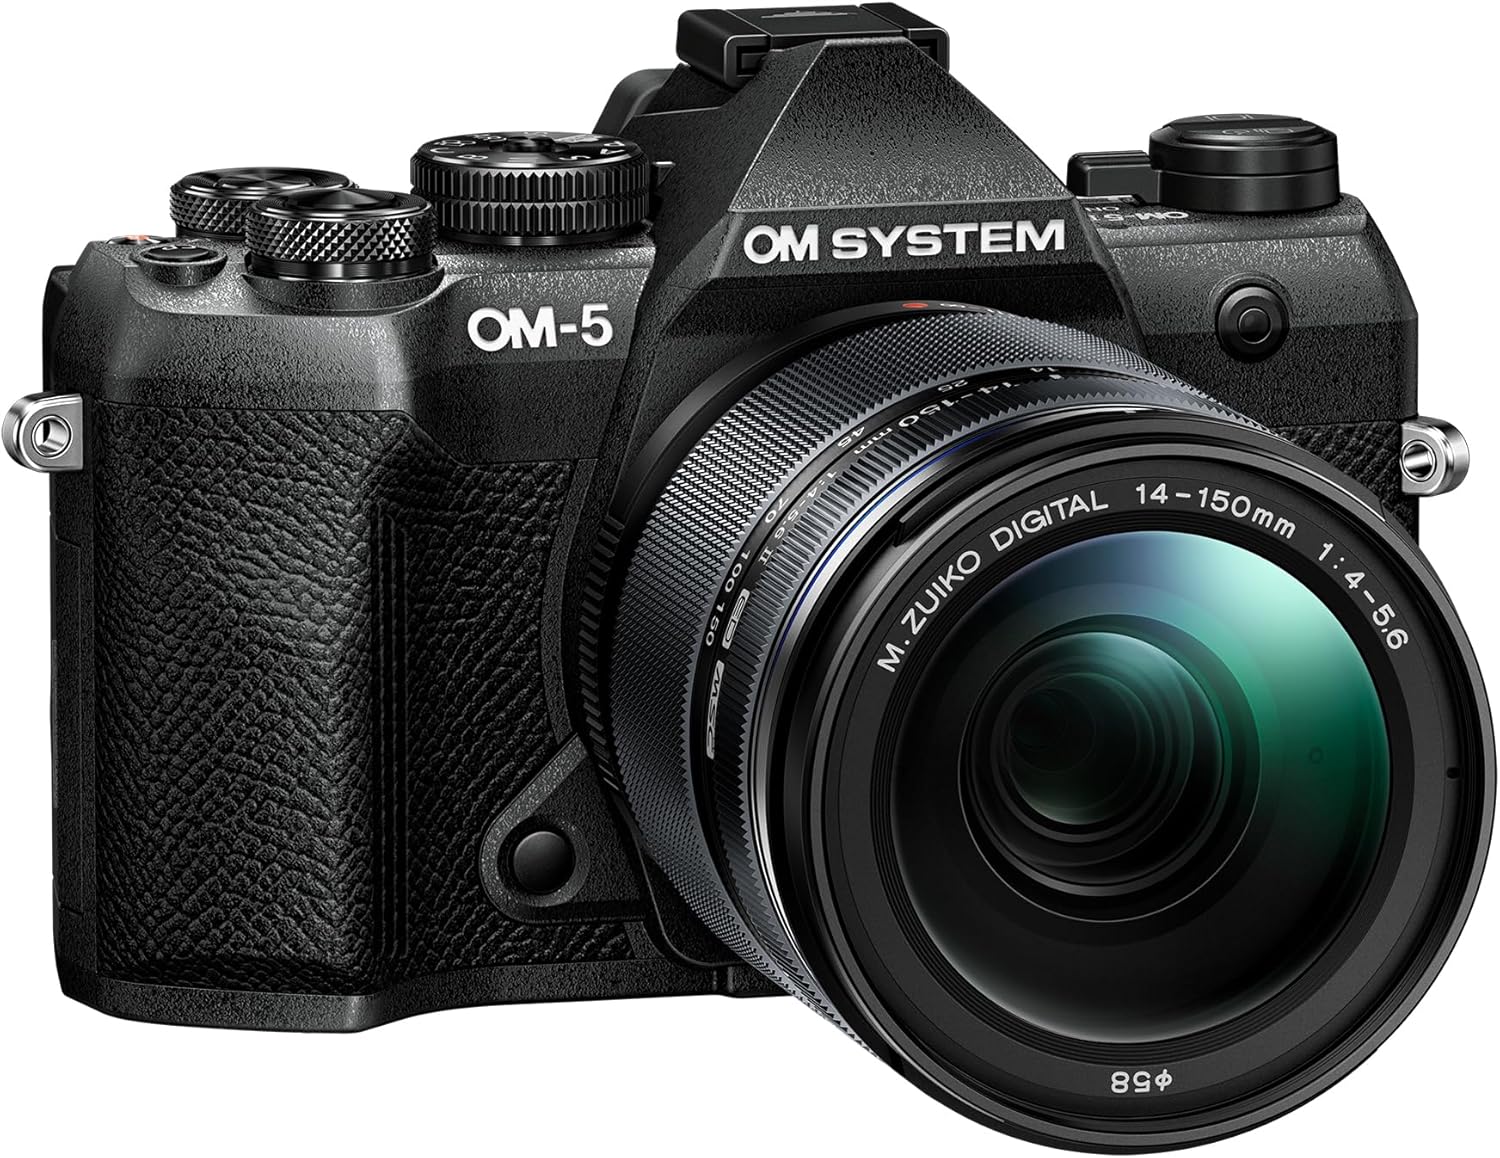
OM‑5 (OM System)
Micro Four Thirds 20 MP
4K UHD video, vertical mode
Moderate (stills‑focus)
DSLR-like duration
Interchangeable
microSD
414 g
IP53
~$1,200–1,600
🎒 Final Thoughts: Snap Smart, Travel Far
Whether you’re a casual adventurer or a full-time globetrotter, the right travel camera can turn fleeting moments into lifelong memories. From budget-friendly compacts to high-end mirrorless beasts, there’s truly something for every explorer in 2025.
Before you buy, ask yourself: 👉 Where am I going? 👉 What kind of shots do I want? 👉 How much gear am I willing to carry?
Remember: the best camera is the one you’ll actually use. Lightweight, intuitive, and suited to your personal travel style.
🔗 Bonus Tip: Don’t forget to check out the custom Dubai Travel Map I created right here to plan your routes and photoshoots better!
So pack your gear, charge those batteries, and go make magic. 🌍✨ Happy travels—and even happier snapping! 📸
Q1: What is the most important feature in a travel camera? For most travelers, the combination of image quality and portability is key. A camera is useless if it’s too heavy to carry around all day. Look for the best sensor and lens quality you can get in a size and weight you’re comfortable with.
Q2: Is my smartphone good enough for travel photography? Modern smartphones are excellent for casual snapshots, social media, and video. However, a dedicated camera will provide significantly better zoom capabilities, low-light performance, image quality for printing, and creative control over settings like aperture and shutter speed.
Q3: Should I choose a DSLR or a mirrorless camera for travel? For new buyers, mirrorless cameras are generally the better choice for travel. They are typically more compact, lighter, and have newer technology like electronic viewfinders and superior video features. DSLRs are often larger but can offer great value on the used market.
Q4: How important is zoom for a travel camera? Very important. A versatile zoom lens (e.g., 18-200mm or 24-105mm equivalent) is ideal for travel as it allows you to capture wide-angle landscapes, standard street scenes, and zoom in on distant architectural details or wildlife without changing lenses.
Q5: What does “weather-sealing” mean and do I need it? Weather-sealing refers to protective seals that guard the camera’s body against moisture and dust. It’s a highly recommended feature for adventure travelers, hikers, or anyone who might be caught in rain, snow, or dusty environments. For casual city travel, it’s less critical.
Q6: What is a good alternative to carrying multiple lenses? A high-quality superzoom camera (also known as a “bridge” camera) with a massive built-in zoom range (e.g., 25x optical zoom) is an excellent all-in-one solution. You sacrifice some image quality compared to interchangeable lens cameras, but gain immense versatility and convenience.
Q7: How much should I budget for a memory card and extra battery? Factor in an extra $50 – $100. You’ll want at least one fast, high-capacity memory card (e.g., 64GB or 128GB) and at least one spare, fully charged battery. Running out of power or storage is a sure way to miss a great shot.
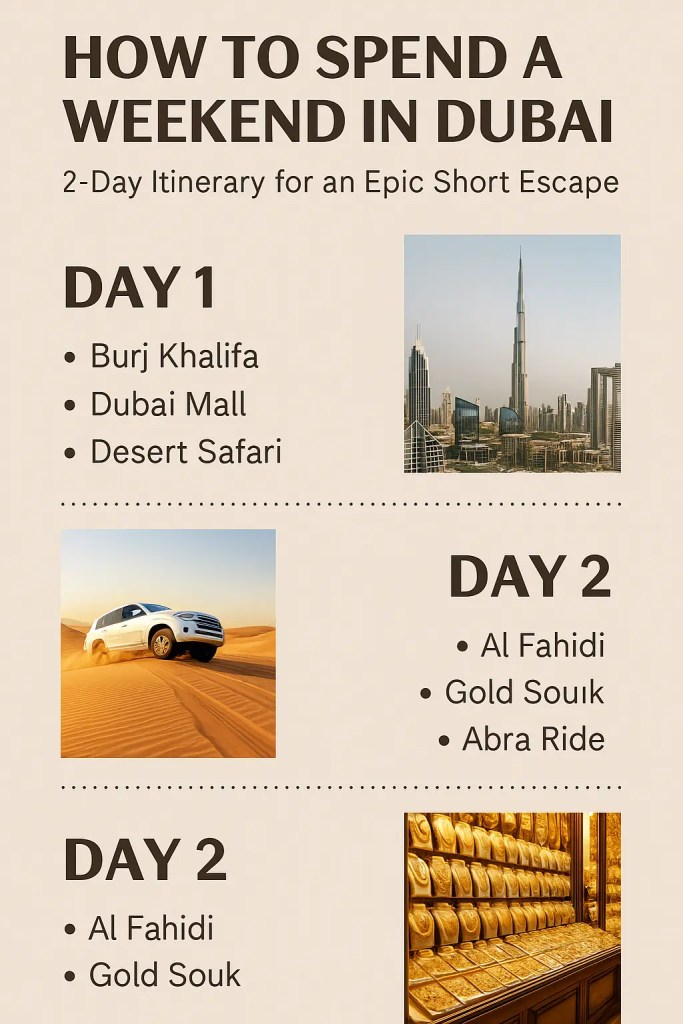
Afternoon: Al Fahidi Historical Neighbourhood & Dubai Museum
Evening: Abra Ride & Exploring the Gold and Spice Souks
Beyond the Itinerary: More Dubai Experiences
Practical Information for Your Trip
Dress Code and Cultural Etiquette
Getting Around the City
Budgeting for Your Weekend
Conclusion: Start Planning Your Dubai Escape
Looking for a weekend that’s equal parts glam, adventure, and mind-blowing architecture? Dubai isn’t just a city—it’s a show. Towering skyscrapers, golden deserts, luxury shopping, and vibrant souks—all crammed into a place that somehow runs on gold and innovation.
And yes, it’s one of the Top 5 Most Visited Cities in the World—for good reason.
So if you’re craving a last-minute escape, pack that passport because Dubai is calling—and she’s extra.
Why Dubai? Why Now?
Because weekends deserve better, and Dubai delivers big. It’s the kind of place where you can camel ride before breakfast. You can skydive over the Palm after lunch. By sunset, sip mocktails on a rooftop with a Burj Khalifa view.
Here’s what makes Dubai the ultimate weekend escape:
Visa on arrival (for many countries—check first!)
World-class hotels and crazy-fast airport transfers
Compact geography—you can do a lot in just two days
Epic activities, from desert safaris to indoor skiing (yes, skiing… in the desert)
✅ Pro Tip: Avoid summer if you melt like a popsicle. Best time to visit? November to March for cool breezes and open-air adventures.
✈️ Flight Delayed or Canceled? Travel isn’t always smooth sailing—sometimes flights get delayed, canceled, or overbooked. The good news? You might be entitled to up to $650 in compensation under air passenger rights. Most travelers never claim it, but I’ve got you covered: just check your flight with AirHelp. They handle the paperwork, fight the airlines for you, and only get paid if you win. Easy, stress-free, and potentially a nice surprise for your travel fund.
✈️ Travel Tip: Staying connected abroad can be tricky (and expensive if you’re relying on airport SIM counters or roaming). That’s why I carry a Drimsim—a universal SIM card that works in 190+ countries without hidden fees. You just pop it into your phone, top up through the app, and you’re online wherever your adventure takes you. No more hunting for local SIM cards or stressing over roaming bills. If you’re planning your next getaway, check it out here 👉 Drimsim: SIM Card for Traveling Around the World.
💡 Pro Travel Tip: While hopping on metro, tram, or bus is super easy, travel hiccups like delays, lost luggage, or sudden medical emergencies can happen anywhere. That’s why I always carry travel insurance before jetting off. It gives peace of mind knowing I’m covered, no matter what. I personally recommend VisitorsCoverage Travel Insurance — quick to book, affordable, and traveler-friendly.
Weekend in Dubai? Yes, Please. Book your luxury escape with Expedia and stay protected with NordVPN—because smart travelers do both.
🕌 Day 1: Touchdown & Straight into the Sparkle
Morning: Land, Check-in, Glow-Up
Airport to Hotel: Uber, Careem, or metro—the ride is smooth and scenic.
Stay Smart: Book a hotel in Downtown Dubai or near the Marina. Both offer easy access to major attractions.
✈️ I always book flexible stays through Expedia to avoid last-minute panic. It’s my stress-free travel hack.
Don’t forget your VPN—especially if you’re checking banking apps or streaming. I use NordVPN to keep my data safe while using public Wi-Fi. Dubai malls have Wi-Fi, but don’t trust everything that glitters.
After the view? Head straight to Dubai Mall—you’ll probably get lost but in the best way.
At 828 meters tall, Burj Khalifa isn’t just a view—it’s the experience that defines the Dubai skyline.Soaring above Dubai at 452 meters, the views from At The Top are simply unreal! Whether it’s sunrise, sunset, or midday sun, this experience will literally take your breath away.Dubai Mall isn’t just a mall—it’s a city within a city, packed with endless experiences.
💸 Save More with Expedia Package Tours Planning your Dubai escape doesn’t have to break the bank. Expedia offers exclusive package deals that bundle your flight + hotel + optional tours, so you not only save time—but serious money, too. Whether you’re eyeing a luxury resort with desert views or a boutique stay near the souks, these curated packages help you experience more for less. Plus, with flexible booking options, you’ve got room to breathe if plans change.
Sign up for a Desert Safari (book online ahead). They’ll pick you up, take you dune bashing, throw in a camel ride, and serve up a dance show + BBQ dinner under the stars.
Bring sunglasses. And patience—for sand in unpredictable places.
From dune bashing to camel rides, Cars and sunset BBQs, the desert safari is an unforgettable adventure.
I still remember my first abra ride—just 1 dirham, but the breeze, the view, the call to prayer in the distance? Priceless.”
💼 Quick Dubai Survival Kit
Here’s how to make your 48 hours feel like a full vacation:
Dress modestly—it’s stylish and respectful.
Cash + Card—most places accept cards, but souks prefer cash.
Metro > Taxi—it’s cheap, clean, and air-conditioned.
Stay Hydrated—especially in the desert.
🌍 Why Dubai Works for Every Kind of Traveler
Whether you’re a solo explorer, luxury lover, or budget adventurer, Dubai adapts to your vibe. You can splurge or save, hustle or unwind—it’s the ultimate pick-your-own-adventure city.
💡 Planning a multi-destination escape? Pair Dubai with budget-friendly beach bliss—like those on my Top 10 Budget Beach Destinations.
🎯 Before You Go…
Here’s how to make your weekend actually count:
Use Expedia to snag last-minute hotel deals and flight bundles.
Get NordVPN for safe browsing at airports and public hotspots.
🎒And if you’re the ultra-prepared type, browse my Paris escape blog for some serious travel inspiration. Trust me—it pairs well with Dubai.
🧳 Final Thoughts: Let Dubai Dazzle You
Dubai isn’t just a destination—it’s a feeling. It’s the desert breeze against your face, the sparkle of a city that never sleeps, and the joy of realizing that even 48 hours can feel like a full-on adventure if you do it right.
So go on. Book the flight. Wear the linen. Post the pic.
📣 Weekend escapes are for living—not just scrolling.
💬 Drop a comment with your Dubai dreams or your favorite secret spot in the city. Let’s make this the most helpful weekend guide on the internet.
“Have you been to Dubai? Drop your favorite hidden gems in the comments below!”
🗺️ Navigate Dubai Like a Local! To make your travel smoother, I’ve created a custom Dubai Car Traveler Map using Google My Maps. It highlights key landmarks, scenic routes, parking spots, and must-see attractions — all tailored for travelers exploring Dubai by car. Whether you’re planning your first drive from Burj Khalifa to Jumeirah Beach or just want a quick stop for coffee with a view, this map gives you a clear visual guide. 👉 Click here to view the Dubai Driving Map
Introduction: Upgrade Your Travel Experience with These Essentials
Universal Travel Adapter: Your Gateway to Power
Portable Power Bank: Never Run Out of Juice
Noise-Canceling Headphones: Your Oasis of Calm
Packing Cubes: The Art of Organized Travel
Portable Wi-Fi Hotspot: Stay Connected Anywhere
How to Choose the Right Gadgets for Your Travel Style
Conclusion: Travel Smarter, Not Harder
Travel smarter, not harder! After a decade of globetrotting—from getting stranded in Bali monsoons to surviving 14-hour layovers—I’ve curated these underrated travel gadgets that solve real-world problems. No fluff, just tested gear with brutally honest pros/cons.
1. Solar-Powered Power Bank: Your Off-Grid Lifesaver
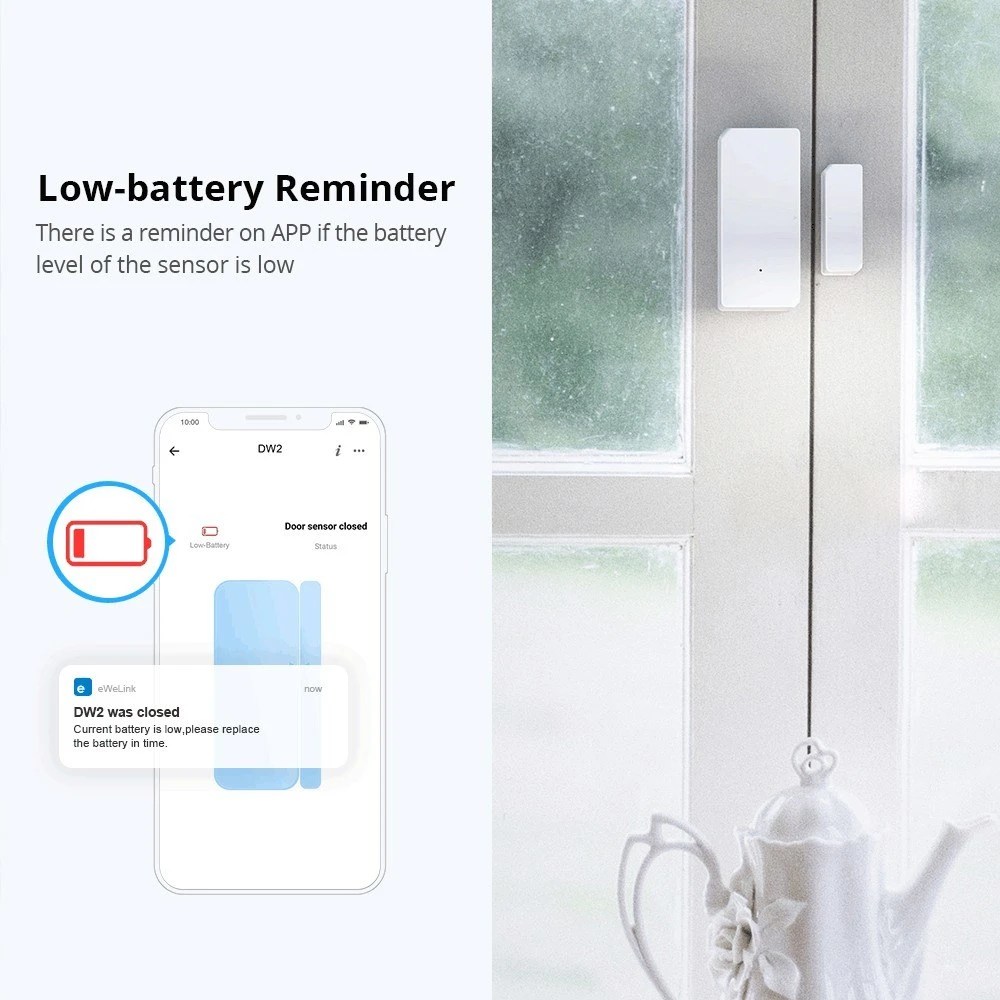
Staying safe while traveling doesn’t mean lugging around heavy gear. The SONOFF DW2 Wireless Door Alarm is a compact, WiFi-enabled sensor that alerts you the second your door or window opens—no drilling or complicated setup required.
Why It’s a Travel Must-Have: ✅ Instant Alerts – Get notifications on your phone if someone enters your room. ✅ No Hub Needed – Connects directly to WiFi, so no extra devices to pack. ✅ Battery-Powered – Lasts months on a single charge (no constant recharging). ✅ Works Anywhere – Stick it on hotel doors, Airbnb windows, or even your luggage as a theft deterrent.
Personal Experience: During a solo trip to Mexico City, I stayed in a charming but slightly sketchy guesthouse. I stuck the SONOFF DW2 on my door, and when housekeeping tried to enter unexpectedly, my phone buzzed instantly. Total game-changer for solo travelers!
If you’re a tea or coffee lover, you know the struggle of finding decent hot water on the go. A foldable silicone kettle is a lifesaver—it packs flat and boils water in minutes.
Why It’s Awesome:
No more sketchy hotel coffee makers
Works with any power outlet
Doubles as a ramen cooker (because sometimes you just need instant noodles)
I never travel without mine—especially after a terrible experience with a “cleaned” hotel kettle in Rome.
After testing 3 foldable kettles, my favorite is this 500ml collapsible model from AliExpress. It boils water in 5 mins, packs flat, and costs less than a Starbucks coffee—perfect for hotel rooms! 🔗 Check current price + 50% off deal (ships worldwide)“
Example 2 (For Safety-Conscious Travelers)
*”I never use sketchy hotel kettles anymore—this $12 foldable kettle is FDA-approved and fits in my toiletry bag. Pro tip: Pair it with a portable coffee filter for fresh brew anywhere!* 📸 See how small it packs | 🔗 Grab it here before the sale ends“
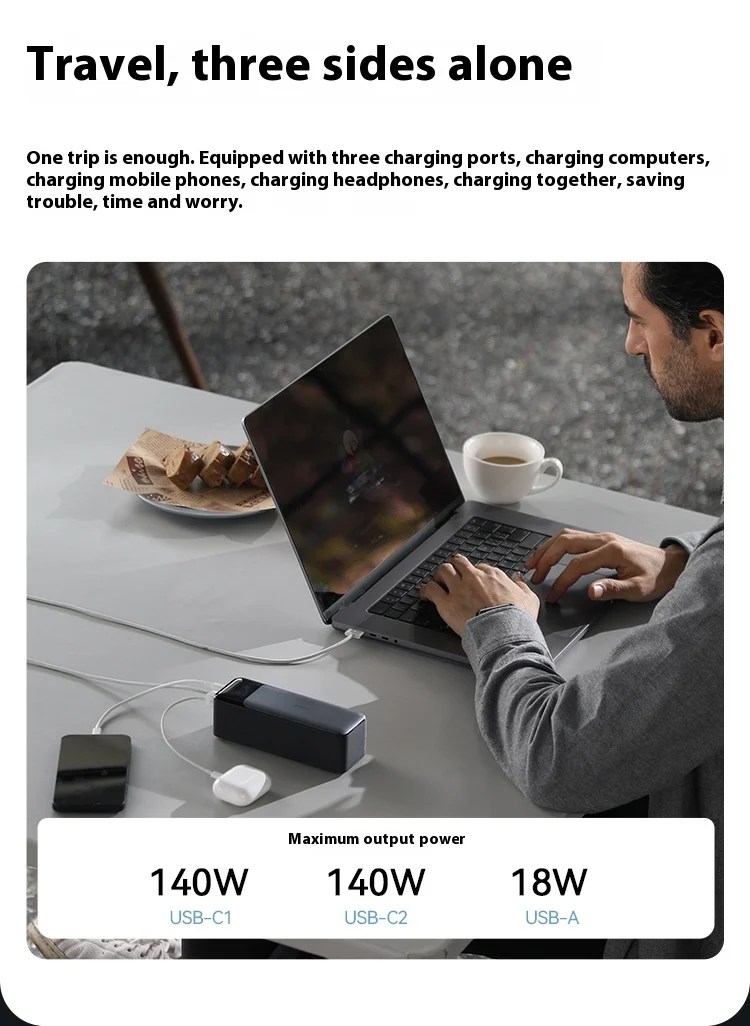
3. Multi-Device Charging Station – No More Outlet Wars
Airports and hotels never have enough outlets. A compact multi-device charging station lets you power your phone, tablet, and earbuds at once without fighting for plugs.
Key Features:
Charges 3+ devices simultaneously
Slim design, perfect for carry-ons
No more leaving gadgets behind
Pro tip: I keep mine in my personal item so I’m never stuck with a dead phone mid-flight.
*“Sharing an Airbnb with 5 tech-addicted friends? The Xiaomi 240W charger saved our group trip—it juiced up 2 laptops, 3 phones, and a drone overnight. Just pack it in your checked bag!”* 🔗Check Price on AliExpress|
The UGREEN 65W GaN Charger (with QC 4.0/3.0 & USB-C PD) is a solid mid-range option for travelers,
✅ Why It’s a Good Travel Pick
65W GaN Power
Charges a MacBook Air to 50% in 35 mins or an iPhone 16 to 70% in 30 mins.
More efficient than older silicon chargers (stays cool even in hot climates).
3-Port Versatility
2× USB-C (65W max) + 1× USB-A (18W) → Works with iPhones, Androids, and laptops.
Compact & Travel-Ready
Smaller than an Apple 61W charger (fits in a sunglasses case).
Not Enough for High-Power Laptops (e.g., MacBook Pro 16″ needs 100W+).
Single USB-A Port → Less ideal for groups (compare to UGREEN 100W 4-port).
No LED Power Indicator (hard to tell if it’s working in dark hostels).
🎯 Who Should Buy It?
✔ Solo travelers with 1-2 devices (phone + laptop). ✔ Budget-conscious buyers (~$30 on AliExpress). ✔ Those needing QC 4.0 (Samsung/Xiaomi users).
Skip If: ✖ You need 100W+ for gaming laptops. ✖ You charge 3+ devices nightly (opt for 4-port models).
4. Mini Bluetooth Tracker – Never Lose Your Luggage Again
How many times have you panicked thinking you left your bag somewhere? A Bluetooth tracker (like Tile or AirTag) slips into your wallet, backpack, or even your checked luggage.
Why It’s a Must:
Track lost items via smartphone
Works globally (bye-bye, lost luggage stress)
Small enough to attach to anything
I once left my carry-on at a café in Paris—thankfully, my tracker led me right back to it!
📹 (Video placeholder: How to use a Bluetooth tracker while traveling)
Mini GPS Locator AntiLost Alarm Wallet Keychain Smart Tag Bluetooth-Compatible Tracer Keychain Dog Pet Child Tracker Key Finder
✅ Why It’s Great for Travelers
Ultra-Compact & Lightweight
Smaller than a coin (fits in wallets, backpacks, or attached to keys).
No bulk—unlike AirTags (which require a separate holder).
Works with “Find My” Apps
Compatible with iOS/Android (uses Bluetooth crowd-finding like Apple AirTag).
Real-time tracking in 100+ countries (via other Xiaomi app users).
1-Year Battery Life
Replaceable CR2032 battery (no charging needed).
Affordable (~$15-20 on AliExpress vs. $29 for AirTag).
Limitations:
No Precision Finding (unlike AirTag’s U1 chip for directional arrows).
Limited Range (~50-100m Bluetooth range; relies on other Xiaomi users for long-distance tracking).
No Water Resistance (don’t attach to swim gear).
🎯 Who Should Buy It?
✔ Budget travelers who lose bags/wallets often. ✔ Android users (better than AirTag’s iOS-only features). ✔ Urban travelers (crowd-finding works best in cities with many Xiaomi users).
Skip If: ✖ You need global GPS tracking (consider a 4G tracker like Tracki). ✖ You’re deep in rural areas (fewer Xiaomi users = less accurate).
Feature
Xiaomi Mini Tracker
Apple AirTag
Price
$15-$20
$29
Compatibility
iOS + Android
iOS only
Precision Finding
No
Yes (U1 chip)
Battery
Replaceable (1 year)
Replaceable (1 year)
“Lost your passport pouch again? This $15 Xiaomi tracker saved me in Bangkok—it pinged my bag’s location at a crowded night market using Bluetooth. Just stick it in your wallet!” 🔗Check AliExpress deal (ships globally)
5. Solar-Powered Power Bank – Energy On the Go
For travelers who venture off-grid or face unreliable power sources.
Regular power banks die, but a solar-powered one keeps charging as long as there’s sunlight. Perfect for hiking trips, beach days, or emergencies.
Why It’s Genius:
Never run out of battery in remote areas
Eco-friendly and durable
Great for long flights without outlets
I took mine on a camping trip in Iceland, and it was a literal lifesaver when my phone GPS was my only map.
2025 Foldable Solar Power Bank – 20000mAh 15W Fast Charging with LED Light & Lanyard for Camping/Hiking (iOS/Android USB-A/C)
Why It’s a Unique Travel Pick
Solar Charging as Backup
20000mAh capacity (charges iPhone 15 ~4.5x or Galaxy S23 ~3x).
Foldable 4-panel solar array (useful in emergencies, though slow—expect 5-8% charge per hour in direct sun).
Dual Fast Charging
15W USB-C/Wireless (faster than most solar banks) + 12W USB-A.
Travel-Ready Extras
Built-in LED flashlight (handy for camping/hiking).
Lanyard + carabiner (attach to backpacks).
Limitations:
Solar is a Last Resort: Takes 30+ hours to fully charge via sun (USB charging is faster).
Bulky When Folded (~2x thicker than standard 20000mAh banks).
No 65W+ Laptop Charging (max 15W—fine for phones, useless for MacBooks).
🎯 Who Should Buy It?
✔ Adventure travelers (hiking/camping off-grid). ✔ Preppers who want emergency solar backup. ✔ Beachgoers (sun + USB combo extends phone life).
Skip If: ✖ You need fast laptop charging (try Anker 737 instead). ✖ You’re mostly in cities (solar is overkill).
🔍 How It Compares to Standard Power Banks
Feature
Foldable Solar Bank
Anker 737 (24K)
Capacity
20000mAh
24000mAh
Solar Charging
Yes (slow)
No
Max Output
15W
140W (for laptops)
Weight
450g
360g
After getting stranded on a Costa Rican hike with a dead phone, I now pack this solar power bank. It’s not perfect, but the solar panels gave me just enough juice to call for help—plus the LED light doubled as a tent lantern!” 🔗 Check AliExpress deal (with lanyard)
Best for: Off-grid adventurers, hikers, or travelers visiting remote areas with unreliable electricity.
Final Verdict: A niche but lifesaving pick for outdoor trips, but not ideal for urban travelers. Highlight its emergency uses over daily convenience.
Anker Prime 737 Power Bank 140w PD Two-Way Fast Charge 24000mAh Portable Powerbank Mobile Power For iPhone Pro MacBook Laptop(not solar—powered)
✅ Why It’s a TOP-TIER Travel Pick
Blazing 140W Charging
Charges a 16″ MacBook Pro to 50% in 30 mins (faster than most wall chargers!).
Two-way fast charging: Refills the power bank itself in 45 mins (via 140W USB-C).
Huge 24000mAh Capacity
Powers an iPhone 15 Pro ~5x, a MacBook Air 13” 1.5x, or a Nintendo Switch 4x.
Smart Digital Display
Shows exact battery % + wattage output (no guessing).
Airplane-Friendly
TSA-approved (under 100Wh limit for carry-ons).
Key Drawbacks
🎯 Who Should Buy It?
✔ Digital nomads needing to charge laptops + phones on the go. ✔ Photographers/videographers with power-hungry gear (drones, cameras). ✔ Tech-heavy travelers who prioritize speed over portability.
Skip If: ✖ You only charge phones/tablets (a 65W bank is cheaper/lighter). ✖ You’re ultra-light packing (try Nitecore 10000mAh at 185g).
🔍 How It Compares to Competitors
Feature
Anker Prime 737
UGREEN 145W
Baseus 140W
Max Output
140W
145W
140W
Capacity
24000mAh (86.4Wh)
25000mAh (90Wh)
20000mAh (72Wh)
Display
Yes (digital)
No
Yes (LED bar)
Best For
Apple ecosystem
Multi-device charging
Budget 140W option
*“As someone who works from beaches and trains, the Anker Prime 737 is my holy grail. It juiced up my MacBook Pro twice during a 14-hour Tokyo-to-Dubai flight—and the display told me exactly how much power was left!”* 🔗Check Aliexpress for current prices |
Best for: City travelers, digital nomads, or anyone needing fast, reliable charging with access to outlets.
Final Thoughts – Travel Smarter, Not Harder
Packing the right gadgets can turn a stressful trip into a smooth adventure. From staying safe with a portable alarm to never losing luggage again with a Bluetooth tracker, these tools are worth every penny.
What’s your favorite travel gadget? Drop a comment below—I’m always looking for new tech to test on my next trip!
Frequently Asked Questions (FAQ)
Q1: Are these gadgets really necessary, or just nice to have? While you can travel without them, these gadgets solve common travel pains. They are designed to reduce stress, save time, keep you connected, and protect your belongings, ultimately making your trip significantly more comfortable and efficient. They shift from “nice-to-have” to “essential” very quickly.
Q2: What should I look for in a universal travel adapter? The best adapters are truly universal, covering outlets in North America, Europe, the UK, Australia, and Asia. Key features to look for include multiple USB ports (especially USB-C for fast charging), a compact design, and built-in safety fuses to protect your devices from power surges.
Q3: How many mAh (milliampere-hour) should a good travel power bank have? For most travelers, a power bank between 10,000mAh and 20,000mAh is the sweet spot. A 10,000mAh bank can charge a smartphone 2-3 times and is still relatively lightweight. If you need to charge multiple devices or a laptop, aim for 20,000mAh or higher.
Q4: Are noise-canceling headphones worth the investment for travel? Absolutely. They are a game-changer for long flights, train rides, or noisy hotels. By blocking out constant ambient noise (like engine hum), they drastically reduce travel fatigue, allow you to enjoy media at lower volumes, and help you arrive at your destination feeling more rested.
Q5: How do packing cubes actually help? Packing cubes revolutionize organization. They compress clothing to save space, separate clean clothes from dirty ones, and organize items by type or day. This means no more rummaging through your entire suitcase to find one item, and they make repacking a breeze.
Q6: Is a portable Wi-Fi hotspot better than using my phone’s international data plan? It often is. A dedicated portable Wi-Fi hotspot (or Pocket Wi-Fi) usually provides a more stable and faster connection, allows multiple devices to connect at once (phone, laptop, tablet), and can be more cost-effective than paying for expensive international roaming fees from your carrier.
Q7: Where is the best place to buy these travel gadgets? Reliable electronics retailers (like Amazon, Best Buy), travel specialty stores, and directly from manufacturer websites are your best bets. Always read reviews to verify quality and performance from other travelers before making a purchase.
Introduction: Are These the Best Budget Travel Headphones?
Unboxing and First Impressions: What You Get
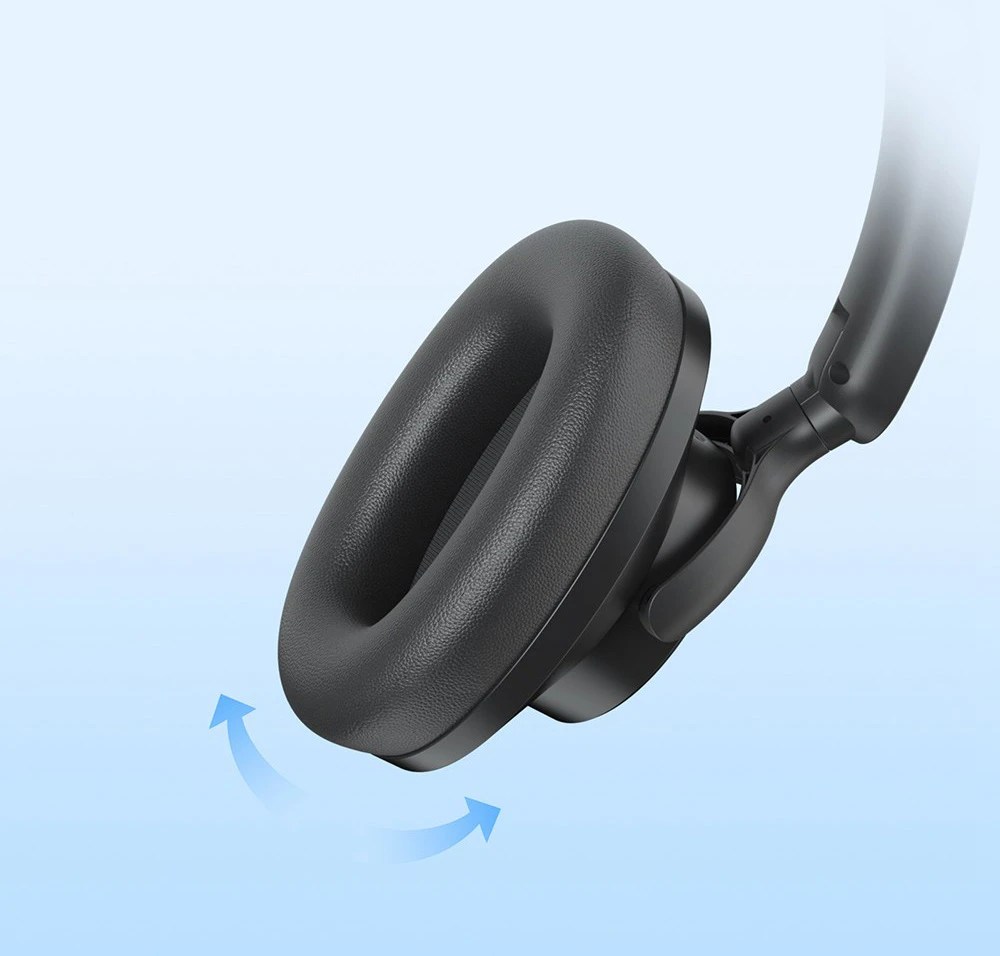
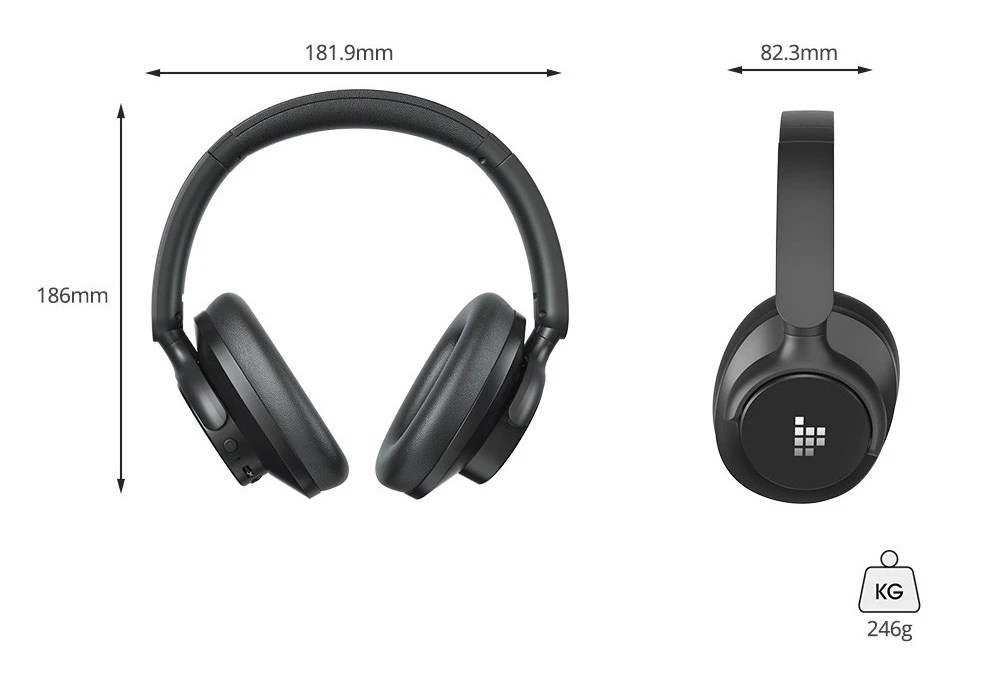
Design and Build Quality: Comfort for Long Journeys
Sound Performance: How Do They Really Sound?
Bass, Mids, and Treble
Active Noise Cancellation (ANC) Tested
Key Features for Travelers
Battery Life: The Marathon Performer
Microphone and Call Quality
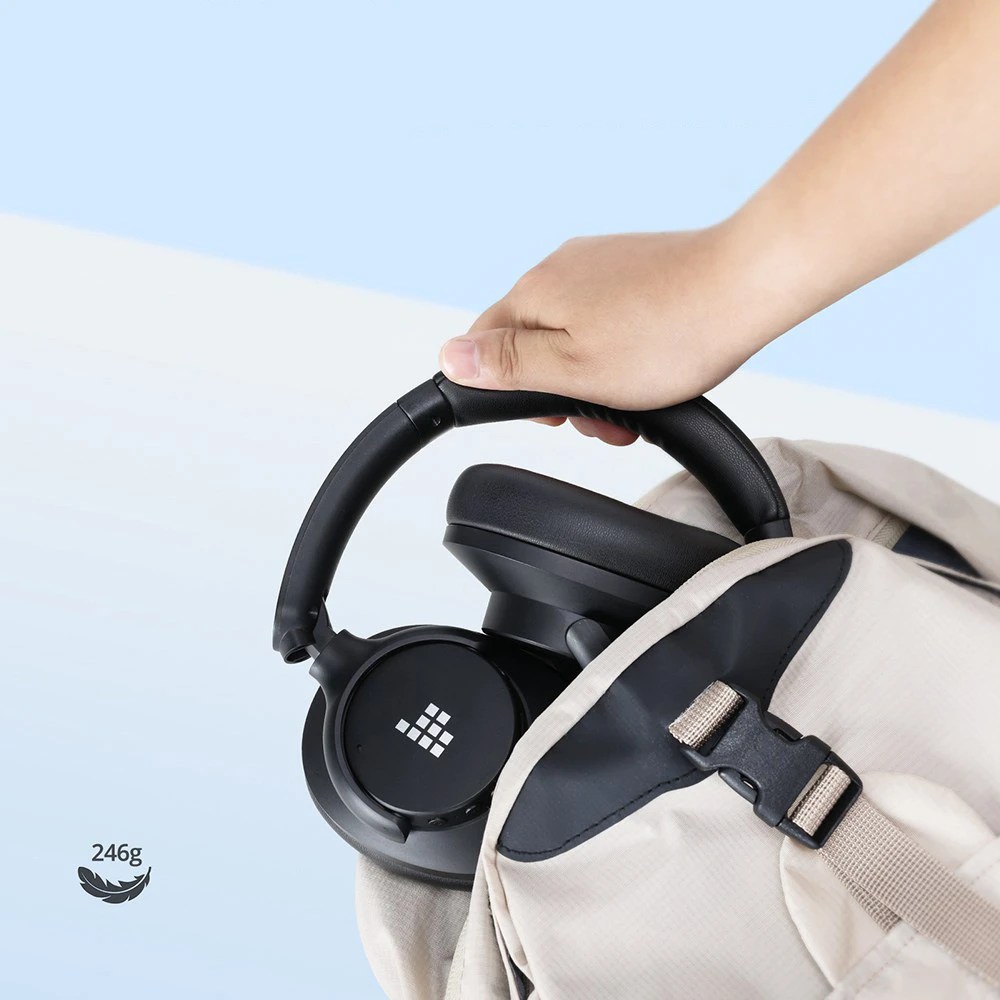
Portability and Foldable Design
Tronsmart Sounfii Q20 vs. The Competition
Pros and Cons: The Honest Verdict
Final Conclusion: Who Should Buy Them?
As a digital nomad, I’ve learned that peace and productivity aren’t found in luxurious coworking spaces — they’re found in the small, smart gadgets we pack. And trust me, after hopping flights, dealing with noisy cafés, and working from hostel lounges with blaring music, the Tronsmart Sounfii Q20 ANC Wireless Headphones are my new MVP.
These aren’t just any headphones. They’re my sanity-savers.
Let’s be honest: most travel-friendly headphones give up after a few hours or crush your ears like walnuts in a vice. Not these. The Tronsmart Q20s come with 50 hours of playtime, 90° swiveling earpads, and active noise cancellation that filters out a whopping 85% of ambient noise.
I tested them on a 12-hour layover in Bangkok cafés . Between the announcements, crying babies, and a chatty stranger beside me (he meant well), I slipped on the Q20s, tapped ANC on, and sank into a sound bubble so silent I could hear my own heartbeat.
They don’t just mute chaos — they cancel it with style.
🧳 Features That Matter When You’re Always Moving
Let’s break down the highlights — no fluff, just real-life wins:
🛠 Feature
💡 Why It Matters on the Road
Active Noise Cancellation
Blocks out city clatter, airplane engines, and office café drama.
Crystal Clear Calls
Built-in mic makes Zoom calls sound like you’re in a studio.
50-Hour Battery Life
That’s an entire work week (or 20 Netflix downloads) without charging.
90° Swiveling Earpads
Fold them. Twist them. Stuff them in your daypack with zero guilt.
Dual Device Pairing
Juggle your laptop and phone like a tech ninja.
EQ Control via App
Customize sound to match your playlist, podcast, or deep work mode.
Rotatable & Portable
Tuck into even the smallest packing cube. Your carry-on says thank you.
✈️ Tested and Loved on the Go
During a recent trip to Cappadocia, I wore these headphones from sunrise balloon rides to sunset editing sessions. And not once did I feel the dreaded ear fatigue. They’re breathable, cushioned just right, and surprisingly durable — even after a clumsy water bottle spill (don’t ask).
They’re now my go-to travel tool, just like the Zeblaze GTR 3 Pro Smartwatch saved me during a health emergency (yep, real story — read it if you haven’t).
💻 Ideal for Remote Work, Too
Whether you’re hopping between coworking spaces in Bali or editing videos in a Thai café, switching between laptop and phone is seamless. I often stream interviews on one device while editing notes on another. No re-pairing headaches, just smooth multitasking.
Pro Tip: Use the Tronsmart app’s EQ tuner to shift between “Podcast Clarity” and “Bass Boost” depending on your focus needs.
🧠 Final Thoughts: Do You Need Them?
If you’re a travel enthusiast, remote worker, or content creator constantly on the move, then YES — these headphones are worth every cent.
They’re sleek, smart, and surprisingly affordable. But most importantly, they allow you to disconnect from the chaos and reconnect with your flow.
Before you hit “Add to Cart,” here are some smart answers to questions fellow nomads, commuters, and audiophiles are asking about the Tronsmart Sounfii Q20:
🔄 Can I update the firmware?
Yes! Just open the Tronsmart app — it’ll notify you with a pop-up whenever a firmware update is available. No complicated steps.
🎧 How do I reset the headphones?
Press and hold the Volume + and Volume – buttons simultaneously for 5 seconds. It’s the tech equivalent of a deep breath.
🔌 Can I use them while charging?
Nope. The Q20 needs a little “me-time” during charging. They won’t function until they’re juiced up.
⏱ How long does it take to fully charge?
Only about 2 hours. After that, you get a massive 50 hours of wireless playtime. That’s more than most flights — and layovers — combined.
📴 Do they automatically power off?
Yes! If there’s no connection or audio input for 30 minutes, they’ll shut down on their own to save battery.
🎙 How do I activate voice assistants like Siri?
Just double-press the Multifunction button, and you’re talking to Siri or Google Assistant in seconds.
⏯ How do I skip tracks?
To go to the next or previous song, press and hold the Volume + or Volume – button for 2 seconds. Super intuitive.
🎵 Can I customize the sound?
Absolutely. Download the Tronsmart app (available on Google Play and the App Store) to adjust the EQ settings and personalize your listening vibe.
📵 Not pairing with your device?
Reset the headphones (Volume + and – for 5 seconds), then try pairing again. It usually fixes connection issues right away.
🔊 What audio codec do they use?
The Sounfii Q20 supports SBC, offering solid, reliable Bluetooth audio across most devices.
💬 Let’s Hear From You!
Have a favorite travel gadget that makes life easier on the road? Tried the Tronsmart Q20s already? Drop your thoughts in the comments — I’d love to feature some real-world user stories in my next post.
🧳 Stay connected. Stay curious. Stay tuned in.
Product Gallery
Sleek, modern, and built for comfort — meet your travel-friendly sound companion.Block the chaos. Focus on what matters.Control your vibe. Customize your EQ via the Tronsmart app.Fold, pack, go. These headphones are designed for life on the move.Switch between devices without missing a beat.Just 2 hours to full charge. 50 hours of freedom.Be heard clearly, even in noisy surroundings.Tronsmart Q20 headphones, charging cable, user manual, and packaging boxBe heard clearly, even in noisy surroundings.
Frequently Asked Questions (FAQ)
Q1: How is the battery life on the Tronsmart Sounfii Q20? The battery life is exceptional. With Active Noise Cancellation (ANC) enabled, you can expect up to 30-40 hours of playtime on a single charge. With ANC turned off, this can extend even further. This makes them ideal for long-haul flights or multi-day trips without needing to recharge.
Q2: How effective is the Active Noise Cancellation (ANC)? The ANC is very effective for its price point. It does an excellent job of canceling out constant low-frequency noises like airplane engine hum, train sounds, or air conditioning. It may not eliminate all higher-frequency sounds like nearby conversations completely, but it significantly reduces overall ambient noise.
Q3: Are they comfortable for wearing for many hours? Yes, comfort is a key strength. They feature plush, memory foam earpads and an adjustable headband that distributes weight evenly. Most users find they can wear them for extended periods, such as on an international flight, without experiencing significant ear fatigue or discomfort.
Q4: Do they come with a carrying case? Yes, the headphones typically come included with a hard-shell zippered carrying case. This case is compact, protects the headphones in your luggage, and is a crucial feature for any travel headphone.
Q5: Can you use them wired or only wirelessly? They offer dual functionality. You can use them wirelessly via Bluetooth for convenience. They also include a 3.5mm audio cable, allowing you to use them in wired mode, which is perfect for plugging into in-flight entertainment systems when you want to save battery.
Q6: How is the call quality for phone/video calls? The built-in microphone with noise reduction technology provides clear call quality in quiet environments. However, like most headphones, call quality can diminish slightly in very windy or noisy settings, but it is more than adequate for standard travel calls.
Q7: Are the Tronsmart Sounfii Q20 headphones worth the price? Absolutely. They are considered a top-tier value proposition. They offer features (like strong ANC and incredible battery life) that are typically found in much more expensive models, making them an outstanding choice for budget-conscious travelers who don’t want to compromise on core performance.
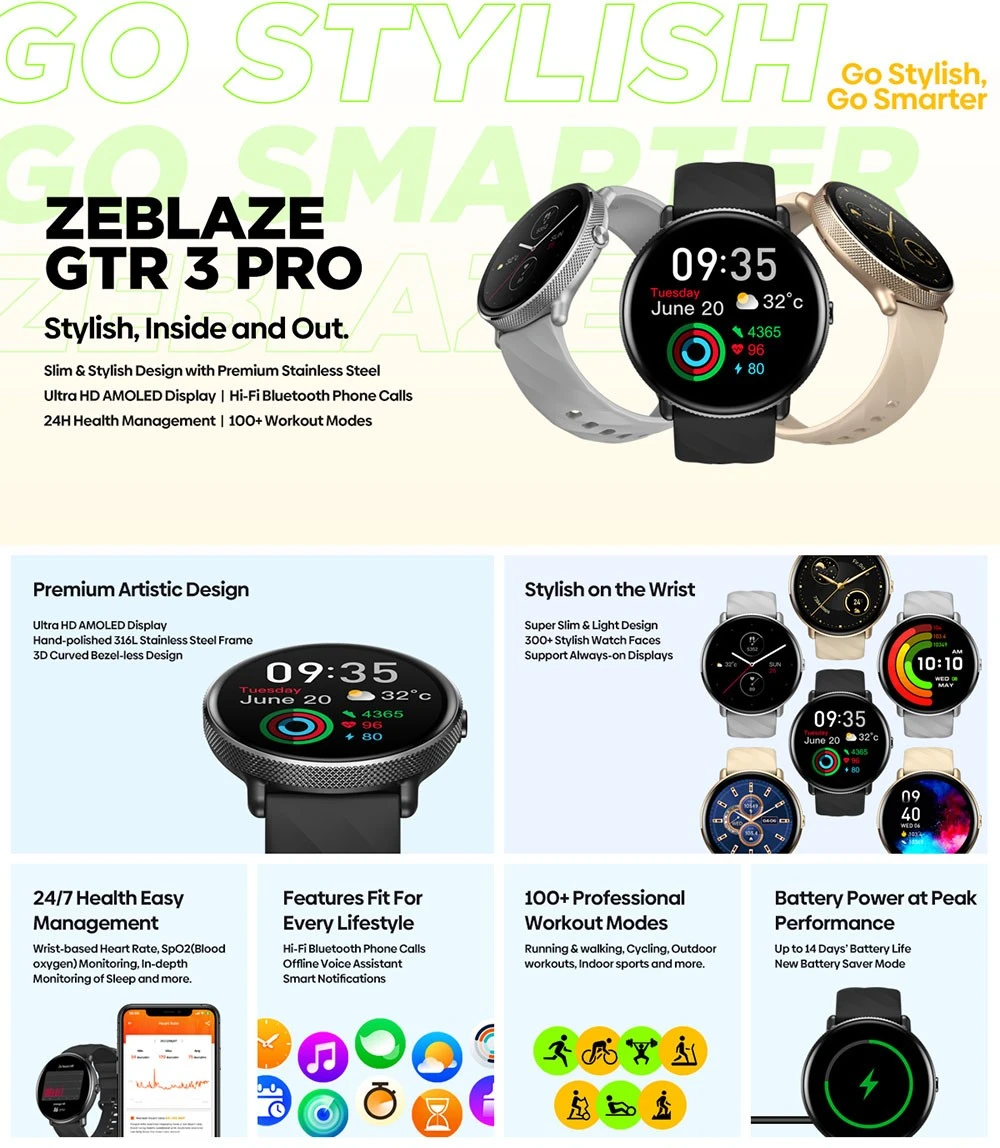
Introduction: More Than a Watch, It’s a Travel Essential
First Impressions: Design and Build for the Adventurer
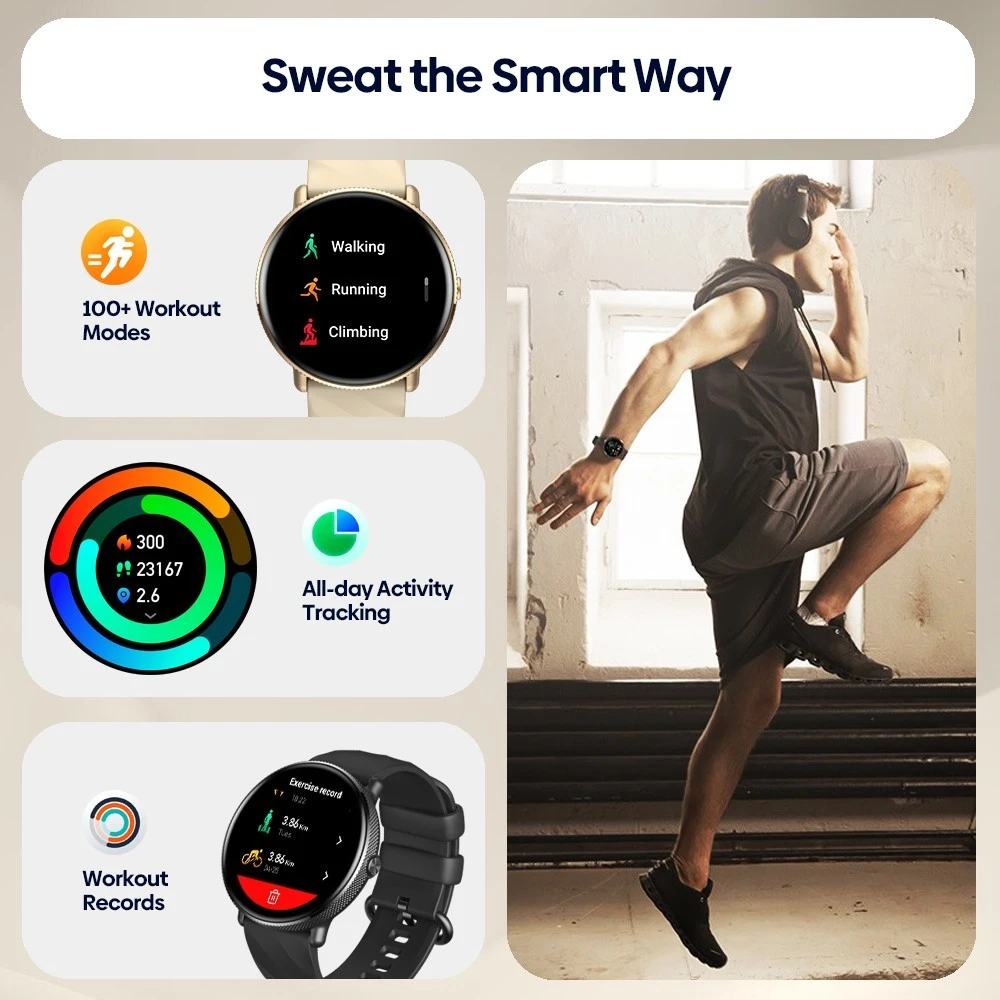
Key Features That Make It a Travel Powerhouse
Battery Life: The Week-Long Charge
Health and Fitness Tracking on the Go
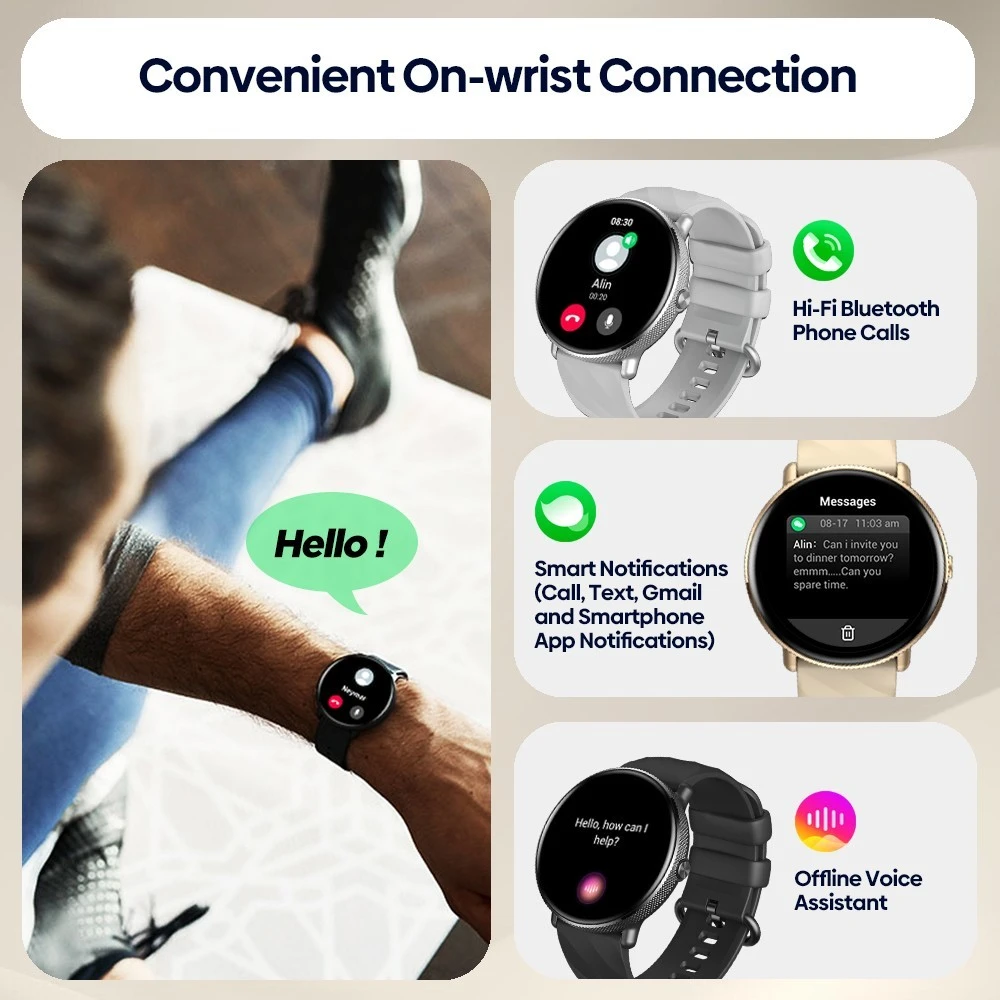
Notifications and Connectivity
Built-in GPS for Exploration
Real-World Travel Test: How It Performed
Pros and Cons: The Honest Breakdown
Final Verdict: Who Should Make the GTR 3 Pro Their Travel Companion?
Location: Chiang Mai, Thailand Gear Tested: Zeblaze GTR 3 Pro Fitness Wellness Smartwatch Reviewed by: A traveler who owes their life to tech—literally.
The Day My Watch Became My Lifesaver
I never thought a smartwatch would end up saving my life. I bought the Zeblaze GTR 3 Pro mostly because it looked sleek, had a killer AMOLED display, and tracked fitness like a pro. Voice calling? Bonus. Blood oxygen monitoring? Sure, why not. I figured, at worst, it’d count my steps. At best, it’d help me look a little more “wellness warrior” on my solo trips.
But during a solo journey in Chiang Mai, Thailand, it did something extraordinary. It called for help when I couldn’t.
What Actually Happened 😳
It was just another sunny morning, and I was hiking the lush trails of Doi Suthep National Park. Suddenly, I felt dizzy, like the world zoomed out from under my feet. My chest tightened, and within seconds, I collapsed. I didn’t have time to reach for my phone, didn’t even process what was happening.
But my Zeblaze GTR 3 Pro did.
Thanks to its real-time health monitoring, the watch detected abnormal heart rhythms and an oxygen drop. The built-in SOS feature activated immediately and used my preset emergency contact to alert local emergency services. Within minutes, I was receiving help.
That little gadget on my wrist? It became my lifeline.
Features That Make Zeblaze GTR 3 Pro a Traveler’s Best Friend 🌐
If you’re like me—someone who lives with hidden health conditions or just loves to explore solo—this isn’t just a watch. It’s your wingman.
🔹 Ultra HD 1.43″ AMOLED Display
You can read this screen under blazing sunlight or a moonlit trail—no squinting required.
🔹 Voice Calling
Lost in translation? Use the watch’s speaker and mic to make a quick call, no fumbling with your phone.
🔹 24/7 Health Monitoring
It tracks heart rate, SpO2, sleep, and even stress levels. Perfect for long flights and remote trekking.
🔹 SOS Emergency Alerts
Your wristwatch doubles as an emergency beacon. You pre-set your emergency contact, and the watch does the rest—even if you’re unconscious.
🔹 Long Battery Life
Lasts over a week on one charge—ideal for backpacking through places with patchy electricity.
🔹 Global Compatibility
Works anywhere. I’ve taken it from Bangkok to Berlin without hiccups.
Why I Recommend It (Especially if You Travel Solo)
As someone who’s always hopping on planes or disappearing into jungles with just a backpack and camera, I’ve tested plenty of gadgets. But none have literally saved my life—until this.
And no, this isn’t some overhyped influencer story. If you’re traveling, especially alone, this smartwatch could be the reason you make it back home.
Let’s break it down. The Zeblaze GTR 3 Pro is not your average smartwatch. It’s a wellness lifesaver and the ultimate travel companion. Here’s why:
🔍 Key Features (That Actually Matter)
1.43″ Ultra HD AMOLED Display – Easy to read even under harsh sunlight (hello, beach bums).
Voice Calling & Bluetooth – Hands-free communication, even when your hands are full of gelato.
Advanced Health Monitoring – Real-time heart rate, blood oxygen, blood pressure, sleep, and stress tracking.
Fall & Seizure Detection – The watch can auto-notify emergency contacts or services.
Built-In GPS – Essential for hikes, city strolls, or when you inevitably get lost in a foreign street market.
Battery Life Up to 15 Days – Because who has time to recharge during an adventure?
🗺️ Ideal for Travelers, Hikers, Parents, and Seniors
I’ve worn it from Bangkok’s bustling night markets to serene hikes in the Swiss Alps. Whether you’re a digital nomad or a weekend wanderer, this smartwatch works as your wellness tracker and silent guardian.
🧑💬 Real User Testimonials
“I bought the Zeblaze for my dad after he fainted once. Two months later, it detected his atrial fibrillation during a hike. We got help instantly.” – Priya S., Canada
“This watch literally alerted me before a seizure. I didn’t even know that was possible. Lifesaver is an understatement.” – Jason K., Germany
📊 Data You Can Trust
![Heart Rate Graph ] ( HR & SpO2 over time – clean, mobile-friendly chart)
📊 Real-time heart rate and SpO₂ trends captured by the Zeblaze GTR 3 Pro – a fitness watch that’s more than just smart.
It doesn’t just monitor you; it logs your data so you can share it with your doctor. I took screenshots of my ECG graph and showed them during my hospital visit. It saved the doctors a lot of guesswork.
💡 Why You Shouldn’t Wait
If you’ve ever felt your heart race while hiking alone, traveling in a new country, or even just doing chores—this watch could be your safety net. You don’t know you need it until you really need it.
And honestly? After what I experienced, I wouldn’t gift a smartwatch that doesn’t have these features. This one does—and it’s surprisingly affordable.
Final Verdict: Not Just a Smartwatch, a Smart Decision ✅
If you’re eyeing a wearable that’s more than a pretty accessory, one that actually watches over you, I can’t recommend the Zeblaze GTR 3 Pro enough.
Travel smart. Travel safe. And maybe—just maybe—let tech have your back when it counts.
Let me know in the comments if you’ve ever had tech save your trip—or your life. Your story might just inspire someone to pack smarter.
Product Gallery:
Frequently Asked Questions (FAQ)
Q1: What is the most impressive feature for travel? The incredible battery life is the standout feature. Lasting up to a week on a single charge (depending on usage), it eliminates the need to carry another charging cable and worry about finding an outlet every night, which is a major advantage for travelers.
Q2: How accurate is the built-in GPS for hiking or exploring a new city? The built-in GPS is highly accurate for tracking routes, distance, and pace. It’s perfect for mapping a run in a new city, tracking a hike, or simply ensuring you can find your way back to your hotel after a day of exploring without draining your phone’s battery.
Q3: Can I receive calls and messages on the watch without my phone? The GTR 3 Pro allows you to receive notifications for calls, messages, and apps directly on your wrist when connected to your phone via Bluetooth. However, to make or take calls directly on the watch without your phone, you would need a model with cellular/LTE capabilities, which this typically does not have.
Q4: Is it suitable for swimming or diving? The watch usually has a high water resistance rating (like 5 ATM), making it safe for swimming in a pool, snorkeling, or facing rain and splashes. It is not, however, designed for deep-water diving or high-pressure water sports.
Q5: Does it support third-party apps like maps or travel apps? It runs on a proprietary OS that supports core health, fitness, and notification functions brilliantly. However, it does not have the extensive third-party app support of watches like Apple Watch or Wear OS. Its strength is in its core functionality and battery life, not a vast app ecosystem.
Q6: How does it help monitor health while traveling? It continuously tracks key metrics like heart rate, blood oxygen levels (SpO2), and sleep patterns. This is especially useful for monitoring your body’s adjustment to new time zones (jet lag), high altitudes, or just ensuring you’re staying active and well-rested during your trip.
Q7: Is the Zeblaze GTR 3 Pro good value for money? Yes, it is considered exceptional value. It packs a robust set of features—long battery life, GPS, health tracking, and a stylish design—at a fraction of the cost of major brand smartwatches, making it a low-risk, high-reward investment for enhancing your travel experience.
Introduction: The Magic of France Lies Beyond Paris
Why You Need a Weekend Escape from the City
Top Weekend Getaway Destinations from Paris
For Royalty & Gardens: The Palace of Versailles
For Champagne Lovers: Reims & Épernay
For Medieval History: The Loire Valley Châteaux
For Coastal Charm: Normandy’s Étretat & Deauville
For Art & History: Giverny & Rouen
Planning Your Trip: A Practical Guide
How to Get There: Train, Car, or Tour?
Where to Stay: Charming Inns vs. City Hotels
What to Pack for a French Weekend
Sample Itinerary: A Weekend in the Loire Valley
Tips for a Seamless and Authentic Experience
Conclusion: Your French Adventure Awaits
Because even Parisians need a break from perfection
Paris—romantic, radiant, and ranked as one of the Top 10 Most Visited Cities in the World—is a dream. But let’s be honest: even dreams come with metro delays and tourist-packed cafés. So what happens when your Parisian bliss needs a little breather? You plan an epic weekend escape, of course.
If you’re craving fresh air, less noise, and a whole new view (without straying too far from croissants), here are the ultimate weekend getaways from Paris. They are infused with travel tips. Enjoy the humor and a sprinkle of wanderlust. the ultimate weekend getaways from Paris—infused with travel tips, humor, and a sprinkle of wanderlust.
✈️ Flight Delayed or Canceled? Travel isn’t always smooth sailing—sometimes flights get delayed, canceled, or overbooked. The good news? You might be entitled to up to $650 in compensation under air passenger rights. Most travelers never claim it, but I’ve got you covered: just check your flight with AirHelp. They handle the paperwork, fight the airlines for you, and only get paid if you win. Easy, stress-free, and potentially a nice surprise for your travel fund.
✈️ Travel Tip: Staying connected abroad can be tricky (and expensive if you’re relying on airport SIM counters or roaming). That’s why I carry a Drimsim—a universal SIM card that works in 190+ countries without hidden fees. You just pop it into your phone, top up through the app, and you’re online wherever your adventure takes you. No more hunting for local SIM cards or stressing over roaming bills. If you’re planning your next getaway, check it out here 👉 Drimsim: SIM Card for Traveling Around the World.
💡 Pro Travel Tip: While hopping on metro, tram, or bus is super easy, travel hiccups like delays, lost luggage, or sudden medical emergencies can happen anywhere. That’s why I always carry travel insurance before jetting off. It gives peace of mind knowing I’m covered, no matter what. I personally recommend VisitorsCoverage Travel Insurance — quick to book, affordable, and traveler-friendly.
🚂 1. Strasbourg – France’s Fairytale Capital
📍Why Go:
With its half-timbered houses and cobbled lanes, Strasbourg feels like stepping into a real-life storybook—one where cheese and wine are mandatory.
🕓 Travel Time:
2 hours via TGV (high-speed train). Smooth, scenic, and snooze-friendly.
🗓 Best Time to Visit:
Late spring or early fall to avoid Christmas-market crowds, unless fairy lights and mulled wine are your thing.
💡 Travel Tip:
Book your train tickets in advance via SNCF Connect to snag discounts. Local trams make exploring the old town easy-peasy—no rental car needed.
📸 Gear Tip:
Want to capture those gingerbread-style houses in all their glory? Pack this travel-friendly camera I swear by—it fits in your day bag and doesn’t scream “tourist.”
“I remember sipping Champagne under the vaulted cellar of Taittinger—cool, quiet, and unforgettable.” “Strasbourg felt like a postcard I never wanted to stop reading.”
Skip the stress of organizing your next amazing adventure with a Etretat vacation package. Whether you’re interested in its food, entertainment or something else, there’s an inexhaustible array of experiences to be had. Any trip to Etretat needs a well-planned itinerary. Fill yours with major attractions
Étretat’s stunning chalk cliffs are proof that nature has a flair for drama—Normandy never looked so cinematic.
🍷 3. Reims – Champagne with a Side of History
📍Why Go:
You don’t need an excuse to drink bubbly where it was born. Add gothic cathedrals and cellar tours? Oui, oui!
🕓 Travel Time:
45 minutes on the TGV. Yes, faster than your Sunday grocery run.
🗓 Best Time to Visit:
Weekdays if you want a quieter tasting experience. Champagne Pommery and Taittinger offer great guided tours.
🧠 Pro Tip:
Take the self-guided Champagne trail or book a vineyard visit through Expedia—it’s fast, flexible, and cancel-anytime friendly (because, let’s be honest, plans change after a glass or three).
Its rich history, cultural experiences and lively atmosphere are only some of the reasons to book a vacation package to Reims. Whatever brings you to this riverfront city, you’re sure to have a fantastic experience. Every trip to Reims needs a well-crafted itinerary. Fill yours with big-name attractions
Reserve a vacation package to Centre-Loire Valley and make planning your getaway easy. With all the details taken care of before you leave, you can focus on enjoying every second in this amazing destination. With so much to see on a trip to Centre-Loire Valley, it can be tricky to know where to begin. Kick off your journey
When a city stay is calling your name, answer it with a vacation package to Giverny. With all your travel plans taken care of before you leave, all you have to do here is focus on making unforgettable memorie
Step into Monet’s brushstrokes—Giverny brings the painter’s dreamy world to life, petal by petal.
“Visit early morning to avoid crowds and enjoy Monet’s garden with just the sound of bees and rustling leaves.”
As much as I adore Paris—the picnics at the Seine, the soft murmur of French conversation over espresso, the baguette smell that basically gives you a hug—sometimes, the city energy can feel like too much. Getting away helps me appreciate Paris more when I return.
If you’ve ever felt the same, take it from me: hop on that train, book that last-minute room on Expedia, and let spontaneity lead the way. You won’t regret it.
📶 Stay Safe Online: NordVPN keeps your data secure on public Wi-Fi in stations, hotels, or that random café with the best croissant of your life.
📷 Travel Camera You’ll Actually Use: My compact travel camera is lightweight, reliable, and captures low-light magic.
🧳 Book Everything in One Spot: From stays to trains, I always book flexible options through Expedia. Less stress, more rosé.
“Compare Destinations at a Glance”
Destination
Vibe
Must-See
Travel Time
Ideal For
Strasbourg
Fairytale
Petite France
2 hrs
Couples
Étretat
Coastal
White Cliffs
2.5 hrs
Nature lovers
Reims
Elegant
Cathedral & Champagne
45 min
Foodies
Loire Valley
Historical
Castles
1.5 hrs
Families
Giverny
Artistic
Monet’s Garden
1 hr
Art Lovers
🗺️ Plan Smart, Travel Smarter Here’s a custom Google Map to guide your weekend escape—because half the journey is already won when you’ve done your homework. Knowing your route, stops, and scenery before hitting the road saves time, gas, and guesswork. Don’t venture out unprepared; take a few minutes to study the map and make your adventure smoother, safer, and stress-free. Click the map and start planning with purpose!
Q1: What is the easiest weekend trip from Paris? Versailles is the easiest and closest trip. It is only a short 45-minute RER train ride from central Paris, making it perfect for a half-day or full-day trip without the need for an overnight stay.
Q2: Is it better to rent a car or take the train? It depends on your destination. The train is fast, efficient, and stress-free for city-to-city travel (e.g., to Reims or Rouen). Renting a car is highly recommended for exploring regions with scattered attractions, like the Loire Valley châteaux or the villages of Normandy, giving you ultimate flexibility.
Q3: How far in advance should I book tickets for places like Versailles? It is highly recommended to book tickets online several weeks in advance, especially for weekends and peak season (spring and summer). This allows you to skip the notoriously long ticket lines and guarantees your entry.
Q4: Can I do a day trip to the Champagne region? Yes, it is possible. Reims is only about 45 minutes by high-speed TGV train from Paris. You can visit a major Champagne house for a tour and tasting and explore the cathedral in a day. However, an overnight stay allows for a more relaxed experience and a visit to Épernay.
Q5: What is the best destination for a two-night trip? The Loire Valley is ideal for a two-night weekend. It allows you time to explore several magnificent châteaux (like Chambord, Chenonceau, and Cheverny) at a relaxed pace, enjoy the local cuisine, and truly immerse yourself in the region’s royal history and beautiful landscapes.
Q6: What should I pack for a weekend in the French countryside? Comfortable walking shoes are essential for exploring cobblestone streets and castle grounds. Pack layers, as the weather can change quickly. Include a light rain jacket or umbrella, and don’t forget a power adapter for your electronics.
Q7: Are these destinations suitable for solo travelers? Absolutely. France’s excellent train system makes it very easy and safe for solo travelers to explore beyond Paris. Joining a guided day tour can also be a great way to see harder-to-reach places like the Loire Valley without a car and meet other travelers.
Let’s be real—when you look good, you feel good. Not in the shallow way, but in that “I just nailed my skincare routine and now I can conquer life” kind of way. Confidence doesn’t always come from the inside—sometimes it comes from a little glass bottle of K-beauty magic.
Meet the SKIN1004 Madagascar Centella Ampoule 55ml—the skincare secret Canadians and Americans are catching onto (finally).
💡 TL;DR: Clear skin isn’t just an aesthetic—it’s a mood. And this minimalist ampoule is here to vibe with your glow-up journey.
Why Does Feeling Beautiful Boost Confidence?
Here’s a little truth serum (pun intended):
When your skin glows, you don’t need a filter.
When your face isn’t screaming “Help me,” your brain can focus on, well… life.
And when you’re not overthinking redness, irritation, or patchy texture, you feel more present in the room.
Confidence is magnetic. And it starts with a few drops of SKIN1004’s Centella Ampoule.
🌿 What Makes SKIN1004’s Madagascar Centella Ampoule So Special?
This isn’t just another “K-beauty must-have” that disappears into your shelf graveyard. It’s a no-nonsense, minimalist miracle worker.
🔑 Key Features at a Glance:
Centella Asiatica Extract: Mother Nature’s answer to redness, irritation, and all things stress-skin.
Minimalist Formula: Nothing fancy, just potent hydration and healing in a bottle.
Water-Light Texture: Absorbs in seconds. No sticky mess. Great for layering.
Skin Type? All welcome—especially sensitive, oily, combo, or breakout-prone skin.
Zero Nasties: No parabens, sulfates, alcohol, or silicones. Also safe for fungal acne and essential oil-free. 🙌
📍Sold in Canada and the U.S., with shipping that doesn’t feel like a long-distance relationship.
🧴 How to Use It Like a Pro
Prep Your Face: Cleanse and tone. You know the drill.
Apply a Few Drops: Into your palms or directly on your face.
Pat Gently: Let your skin drink it up.
Layer Up: Follow with your favorite serum or moisturizer (or both if you’re feeling luxurious).
🕐 Use AM + PM for best results. Your future face will thank you.
💬 SKIN1004 Ampoule – FAQ
Q: Is it suitable for oily or acne-prone skin? A: Absolutely. It’s lightweight, non-greasy, and even fungal-acne safe.
Q: Can I use it with other active ingredients? A: Yes! It’s gentle enough to layer with niacinamide, azelaic acid, or hyaluronic acid.
Q: How long does one bottle last? A: Typically 6–8 weeks with twice-daily use.
💡 Pro Tip: Layering it after a calming serum like the Anua Azelaic Acid 10% + Hyaluron Serum can create the ultimate irritation-free skincare sandwich—perfect for sensitive skin days.
💸 Use Code Lalax10 for a Sweet Discount
Because glowy skin should never break the bank. When you buy from Lakinza, use coupon code: Lalax10 at checkout to save a little extra for your next skincare haul. Trust me, you’ll want more.
Imagine walking into a room and feeling like you don’t have to hide behind concealer. You smile more. You say yes more. You show up more. That’s what this ampoule gives you—not just hydration, but a little swagger in a bottle.
Product photos
This minimalist miracle has Canadians and Americans buzzing—and for good reason. One bottle. One powerful formula. Your skincare routine just got upgraded.Just like your skin—resilient, glowing, and ready for anythingPerfect for sensitive skin, this K-beauty essential is your daily hydration boost.Feels like water, works like magic. Absorbs in seconds, no greasy residue.No gimmicks—just skin-loving ingredients that actually work.Say goodbye to redness and irritation. Your glow-up is just a few drops away.Close-up of SKIN1004 product label showing key ingredient info
🎯 Final Thoughts: Beauty Isn’t Vanity, It’s Power
You deserve to feel good in your skin—without filters, without fear, and definitely without flare-ups. SKIN1004’s Centella Ampoule is more than just skincare. It’s your quiet confidence, bottled.
So go on. Glow up. Show up. Confidence looks good on you.
📸 Now That You’re Glowing, Capture It!
Let’s be honest—when your skin is this clear, it deserves a little screen time. You’re not just feeling confident—you’re looking confident. So why not celebrate it?
Whether it’s a subtle no-makeup selfie or a full-on glow-up reveal, you’ll want to capture that radiant skin in high quality. 👉 That’s where the Canon EOS R100 – Travel-Ready Mirrorless Camera comes in. It’s compact, powerful, and perfect for crisp selfies, GRWM reels, and content that pops.